Overbought and Oversold Meaning (Examples, RSI Guide)

Overbought and oversold meaning illustrated with RSI indicator and stock chart signals

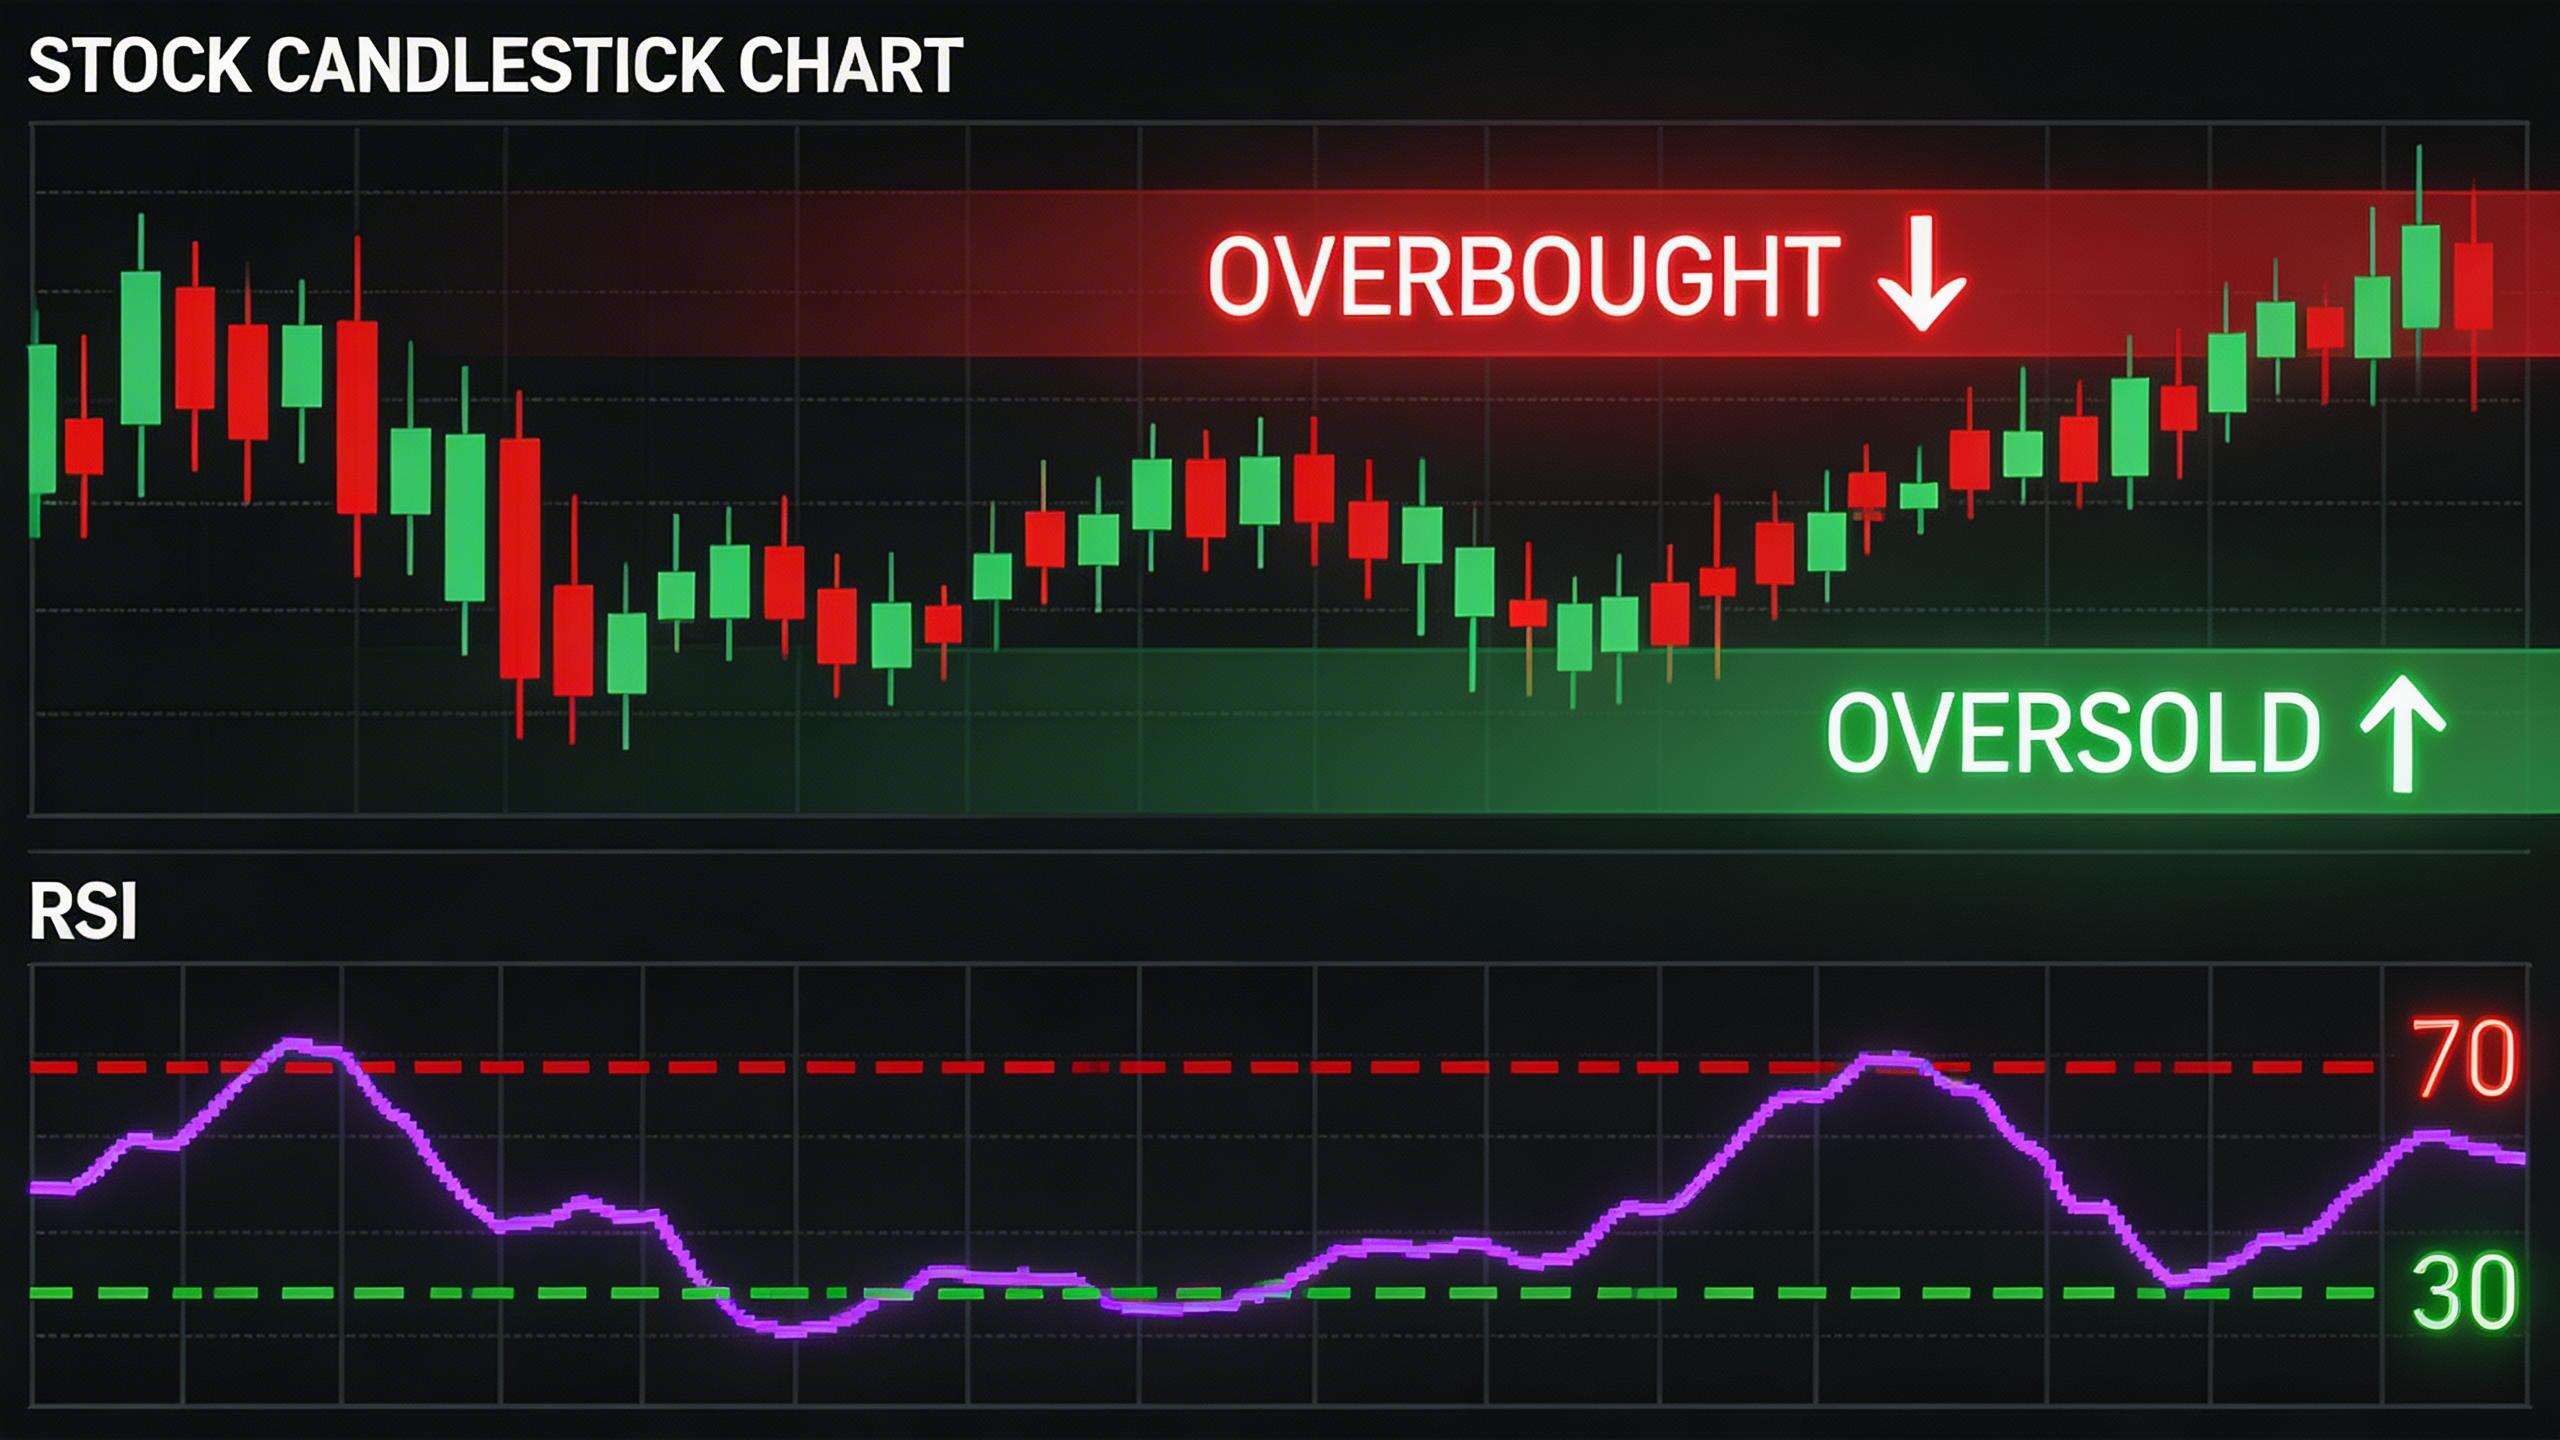
A regular investor must be familiar with the terms Overbought and Oversold, or OB and OS, in the stock market. These are the two significant phases of a market movement. Finding a proper Entry time is considered the most important decision in trading. When the OB or OS situation reaches the extreme point, the reverse … Read more

How to use the Prime Number Oscillator?

Prime Number

The prime number oscillator indicator indicates the nearest prime number, be it at the top or the bottom of the series, and outlines the difference between that prime number and the respective series. Like its band version, this oscillator is also developed by Modulus Financial Engineering Inc. Determining market trends has become a science even … Read more

What is Stop Loss in Stock Market for Newbies?

What is Stop Loss in Stock Market pic

One and only objective of any kind of investment is making a profit. By avoiding loss, every investor tries to make a highly profitable return. There are many investors who don’t realize what to do to secure themselves in the share exchange. There are a few policies and strategies that you can use to shield … Read more

How to Multiply Your Wealth with ULIP?

Multiply Your Wealth With ULIP

ULIP stands for a unit-linked insurance plan. Unit-linked meaning that there are two kinds of plans that are linked together to give the investor double the benefits under the name of one plan which helps you to get twice the benefits for the price of one. The ULIP plan is a combination of 2 plans, … Read more

What is Target in Stock Market and its Importance

Target pic

All of the investors are acquaintedΒ with the term ‘target’ in the stock market. Target refers to a valueΒ at which an investor or trader is willing to book his profit. It is also known as the ‘take profit level’. Usually, traders prefer to use this target option for future trading or intraday trading. This content “What … Read more

Prime Number Bands Indicator Features & Usage

Prime Number Bands

Determining market trends has become a science even though a high number of people still believe it’s a gambling game. Mathematicians, technicians, brokers, as well as investors, have worked together in developing quite several indicators to help them better understand and forecast market movements. The Prime Number Bands indicator was developed by Modulus Financial Engineering … Read more

Piotroski F Score Strategy: Spot New Multibaggers

Piotroski score pic

There are a number of strategies available in the market to identify profitable stocks. The Piotroski F score strategy is one of them. Many well-known analysts believe that by applying the Piotroski F score strategy one can find multibagger stocks. An accounting professor at Stanford, Joseph Piotrosk, developed this strategy. The strategy was named after … Read more

Price Volume Trend Indicator Formula & Strategy

Price Volume Trend

The Price Volume Trend Indicator (PVT) is a technical momentum indicator that relates price and volume. It is utilized by investors and analysts to identify the parity between the supply and demand of a stock. This indicator was invented by Joseph E. Granville. What is the Price Volume Trend Indicator? Traders use both the Price Volume … Read more

Price Rate of Change Indicator Formula & Strategy

Price Rate of Change Technical Indicator

The Price Rate of Change (PROC) or Rate of Change (ROC) indicator is aΒ price-based technical oscillator. It is a pure momentum oscillator that measures the percent change in price from one period to the next. The Rate of Change or ROC indicator mainly reflects the overbought and oversold situation. What is the Rate of Change … Read more

How to Identify a Double Top Stock Chart Pattern?

Double Top Stock Chart Pattern

Today we are going to discuss one of the most common and active chart formations. Along with the fundamental analysis, in-depth technical research is also required to predict price movements and market scenarios. Double top stock chart pattern indicates a reverse trend which appears at the end of the trend. Therefore, it is a bearish … Read more

Different Types of Mutual Funds in India

Different Types of Mutual Funds in India

Various types of mutual funds in India are continuously evolving. In our modern world earning money is not just enough. In order to lead a comfortable lifestyle, the bank’s interest rate is inadequate. One has to do smart investment management. Pros recommend that don’t put all your eggs in one basket. You must save some … Read more

🟣 Zerodha Best Overall 🟒 FYERS Best Charts πŸ”΅ Upstox Beginner Friendly