RSI Indicator (Relative Strength Index) Explained

Relative Strength Index

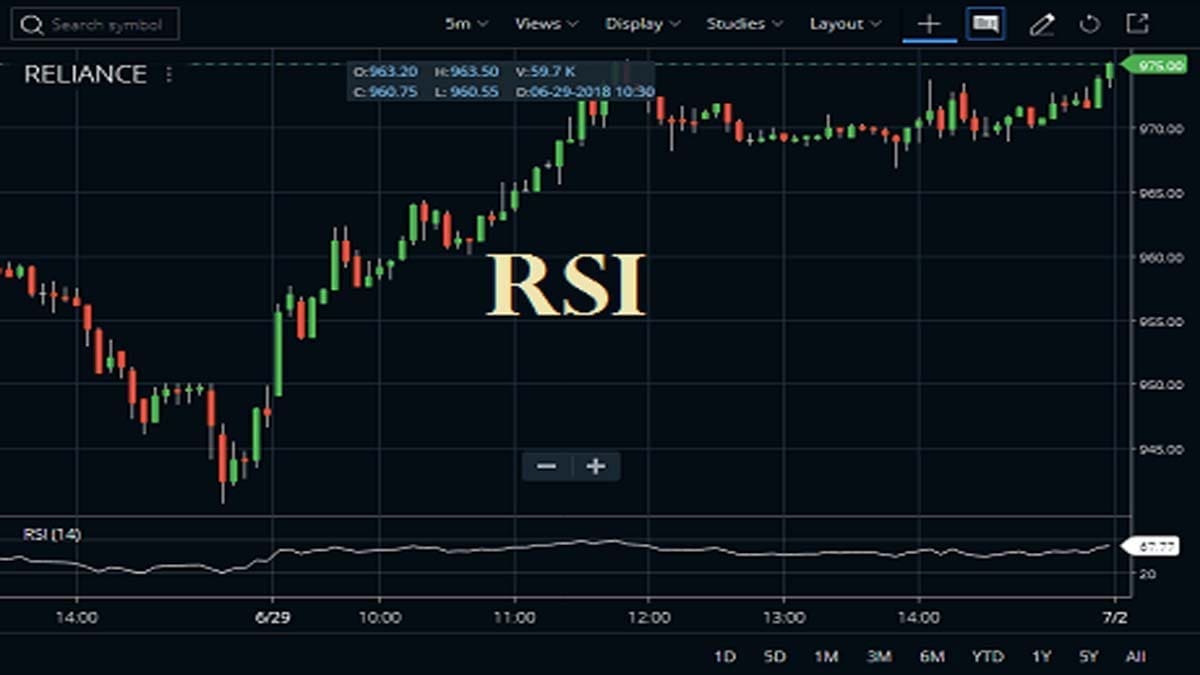
The Relative Strength Index or in short form RSIΒ indicator is a momentum indicator. This indicator measures the magnitude of recent price changes to analyze overbought or oversold conditions. It is also a momentum oscillator. It also measures the speed and change of price movements and this oscillator oscillates between zero and 100. This indicator is … Read more

RAVI Indicator Settings, Calculation, Usage

RAVI Indicator

Range Action Verification Index or the RAVI indicator is a forex trading indicator. This is a very simple forex trading tool. This indicator should be used as a signal confirmation indicator rather than a signal generator indicator. Only in a trending market condition, this RAVI works well. Traders might get lots of fake signals and … Read more

Glenmark Pharma Share Price Graph Analysis

Price graph

Introduction Glenmark Pharmaceuticals Limited, established in 1977, is a prominent player in the pharmaceutical industry. The company operates globally, catering to over 80 countries, including India, the United States, the EU, Japan, and South America. In this article, we will delve into an analysis of the Glenmark Pharma share price graph to provide insights for … Read more

Kagi Chart Trading Strategy: Noise-Free Charting

Kagi Chart Trading Strategy

In our previous article, we discussed the Heikin Ashi chart pattern. Today we will introduce you to Kagi Chart Trading Strategy. Like Heikin Ashi and Candlestick pattern, it was also developed in Japan. There is a slight difference between the traditional chart pattern and the Kagi chart pattern. Unlike traditional charts like the candlestick, bar, … Read more

QStick Indicator, Formula, and Trading Strategy

QStick Indicator Formula

The Qstick indicator is a momentum indicator that provides a measurement of buying or selling strength in a market. It’s basically a calculation of the difference between the open and close prices. The indicator is designed to indicate net price gains or losses over a specific time period. This type of indicator was designed by … Read more

Psychological Line Indicator Usage, Trading Tips

psychological lines defination

The Psychological Line Indicator (PLI) works like other oscillators. It is based on the assumption that traders will resist paying more for a share than others unless obviously, the share continues to move up. Oppositely, traders resist selling a share for less than the price others have been getting for it, except if the price … Read more

Different Types of Orders in Stock Market

Different Types of Orders in Stock Market

If a person doesn’t have any basic knowledge regarding the market mechanics and transaction process in the stock market, he is not considered to be a proper investor. You need to know all the process to place your order in the stock market so that your broker get the proper instruction to execute your order. … Read more

Pring Special K Indicator Settings, Usage, Strategy

Prings Special K

The Pring Special K indicator is a momentum indicator which is created by Martin Pring. This indicator is combining multiple time frames, i.e., short-term, intermediate as well as long-term velocity into 1 complete series. Thus it gives us true summed cyclicality. There areΒ two functions of the Pring Special K indicator- Calculation of Pring Special K … Read more

Double Bottom Pattern Rules and Example

Double bottom pic

In our previous write-up, we discussed the double-top chart pattern with a current example of Manappuram Finance. Today let’s focus on the rules of the double bottom pattern which is quite important like the double top. These patternsΒ are one of the most commonly found patterns in the stock market. Though there are thousands of patterns … Read more

Pring’s Know Sure Thing Indicator (KST) Strategy

Know Sure Thing

Know Sure Thing Indicator (KST) is a momentum oscillator based on the smoothed rate-of-change for four different time frames. Martin Pring, the author of Complete Guide to Technical Analysis An Indian Perspective, developed the indicator. Pring referred to this indicator as to the “Summed Rate of Change (KST)”. KST measures price momentum for four different … Read more

🟣 Zerodha Best Overall 🟒 FYERS Best Charts πŸ”΅ Upstox Beginner Friendly