Rainbow Moving Average Indicator Usage Guide

Rainbow Moving Average Settings

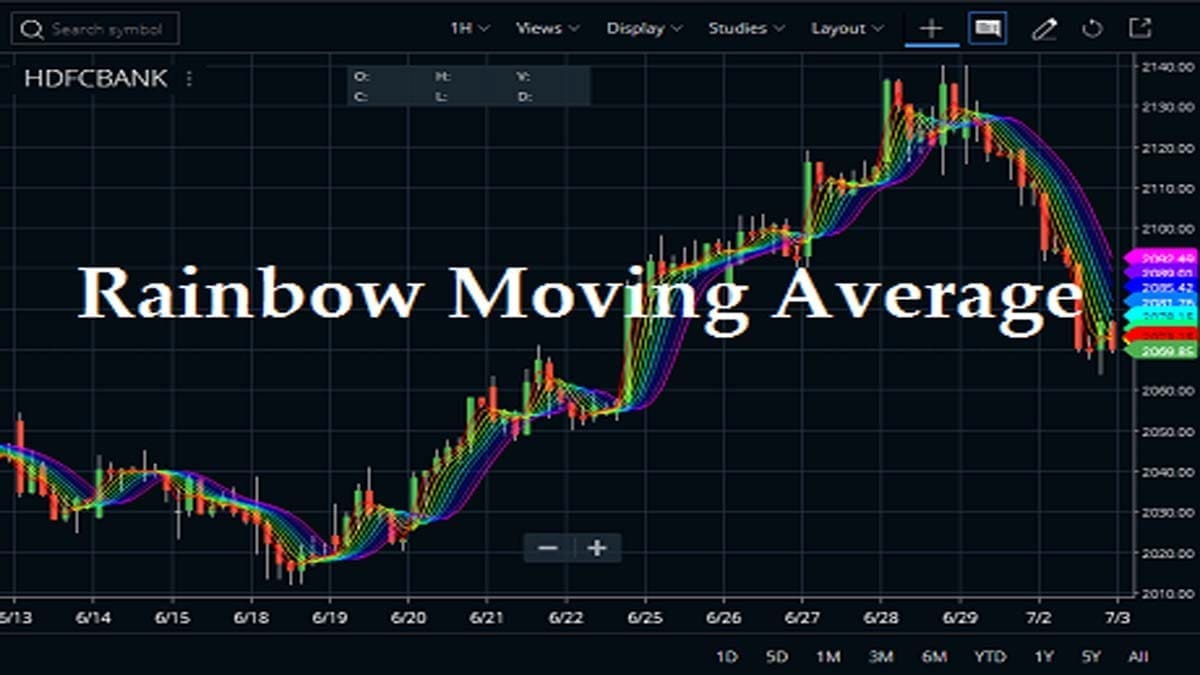
The Rainbow Moving Average indicator shows multipleΒ SMA (simple moving averages) all at once for a particular time period.Β The trading strategy of the Rainbow Moving Average indicator has already gained quite a lot of popularity among traders. This indicator is quite useful for intraday as well as swing traders. Earlier, we posted articles on Moving Averages. … Read more

What Does FnO Ban Mean & its Impact on Stocks

What Does FnO Ban Mean-pic

Introduction: Understanding Derivatives in Future and Options (FnO) When we talk about Future and Options contracts, the term ‘Derivatives’ automatically comes to mind. A derivative is a contract between two or more parties, with its value based on an agreed-upon underlying asset. As this article focuses on an important aspect of the Future and Options … Read more

RSI Indicator (Relative Strength Index) Explained

Relative Strength Index

The Relative Strength Index or in short form RSIΒ indicator is a momentum indicator. This indicator measures the magnitude of recent price changes to analyze overbought or oversold conditions. It is also a momentum oscillator. It also measures the speed and change of price movements and this oscillator oscillates between zero and 100. This indicator is … Read more

RAVI Indicator Settings, Calculation, Usage

RAVI Indicator

Range Action Verification Index or the RAVI indicator is a forex trading indicator. This is a very simple forex trading tool. This indicator should be used as a signal confirmation indicator rather than a signal generator indicator. Only in a trending market condition, this RAVI works well. Traders might get lots of fake signals and … Read more

Glenmark Pharma Share Price Graph Analysis

Price graph

Introduction Glenmark Pharmaceuticals Limited, established in 1977, is a prominent player in the pharmaceutical industry. The company operates globally, catering to over 80 countries, including India, the United States, the EU, Japan, and South America. In this article, we will delve into an analysis of the Glenmark Pharma share price graph to provide insights for … Read more

Kagi Chart Trading Strategy: Noise-Free Charting

Kagi Chart Trading Strategy

In our previous article, we discussed the Heikin Ashi chart pattern. Today we will introduce you to Kagi Chart Trading Strategy. Like Heikin Ashi and Candlestick pattern, it was also developed in Japan. There is a slight difference between the traditional chart pattern and the Kagi chart pattern. Unlike traditional charts like the candlestick, bar, … Read more

QStick Indicator, Formula, and Trading Strategy

QStick Indicator Formula

The Qstick indicator is a momentum indicator that provides a measurement of buying or selling strength in a market. It’s basically a calculation of the difference between the open and close prices. The indicator is designed to indicate net price gains or losses over a specific time period. This type of indicator was designed by … Read more

Psychological Line Indicator Usage, Trading Tips

psychological lines defination

The Psychological Line Indicator (PLI) works like other oscillators. It is based on the assumption that traders will resist paying more for a share than others unless obviously, the share continues to move up. Oppositely, traders resist selling a share for less than the price others have been getting for it, except if the price … Read more

Different Types of Orders in Stock Market

Different Types of Orders in Stock Market

If a person doesn’t have any basic knowledge regarding the market mechanics and transaction process in the stock market, he is not considered to be a proper investor. You need to know all the process to place your order in the stock market so that your broker get the proper instruction to execute your order. … Read more

Pring Special K Indicator Settings, Usage, Strategy

Prings Special K

The Pring Special K indicator is a momentum indicator which is created by Martin Pring. This indicator is combining multiple time frames, i.e., short-term, intermediate as well as long-term velocity into 1 complete series. Thus it gives us true summed cyclicality. There areΒ two functions of the Pring Special K indicator- Calculation of Pring Special K … Read more

🟣 Zerodha Best Overall 🟒 FYERS Best Charts πŸ”΅ Upstox Beginner Friendly