
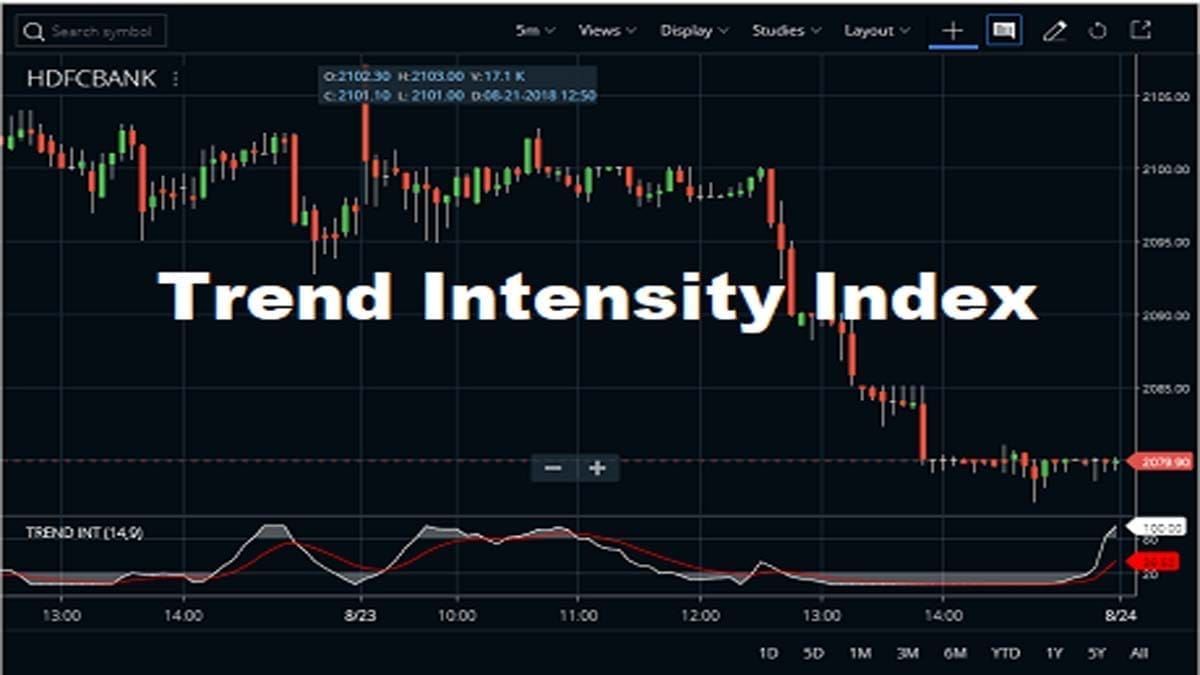
Traders use the trend intensity index indicator (TII) to measure the strength of a trend of a stock, ETF, index, or any other listed security. M. H. Pee developed this technical indicator. The TII indicator applies RSI principles of calculation (applied to the closing price deviations) instead of the closing prices. In technical analysis, the TI index indicator helps to generate trading signals. The assumption is based on the stronger the current trend is, the more likely the analyzed stock (index, ETF, etc.) will continue moving in the direction of the ongoing trend.
FAQ
The trend intensity index has some of the same characteristics as RSI (relative strength index). Traders use this to identify the current market trend, whether it is up or down. With the help of the TII indicator, traders can enter into a trade and can ride until it shows a reversal signal.
The Trend Intensity Index indicator oscillates around 50% level in the 0 to 100% range. Therefore, The TII readings above 80% are an indication of a strong bullish trend. And TII readings below 20% are an indication of a strong bearish trend. The movement of the indicator toward the 50% center line would suggest a weakening of the ongoing trend.
Pee recommends using a major period of 60 and a minor period of 30. The indicator ranges from a lower limit of 0 to an upper limit of 100. Here, a TII value above 50 signals consider an uptrend while below 50 is a downtrend. There is an overbought-oversold zone also. In default settings, above 80 is overbought, and below 20 is oversold.
What is the Calculation of the TII Indicator?
By applying RSI (Relative Strength Index) principles to the closing price deviations you can calculate the Trend Intensity Index indicator. There are a few steps, these are as follows:
First, calculate the Simple Moving Average (SMA) of the closing prices.
- SMA = SMA(Close, n)
- Here, n is the SMA bar period
Then, calculate the Positive and Negative deviation of the closing prices from SMA calculated in Step 1.
- Dev = Close – SMA
- IF Dev > 0 then posDev = Dev
- IF Dev < 0 then negDev = abs(Dev)//absolute value
After that, calculate the sum of Positive and Negative deviations for the period. And it is twice smaller than the period used for SMA calculation. For instance, if you calculated 60-bar SMA then the sum is calculated for 30 bars only.






- SDpos = sum(posDev, m)
- SDneg = sum(negDev, m)
Here, m is the period twice smaller than n (the period used to calculate SMA).
- m = n/2. If the bar period number (n) is not even then m = (n+1)/2.
Calculate finally Trend Intensity index (TII)
- Trend Intensity Index = 100 * (SDpos) / (SDpos + SDneg)
Lastly, calculate the second line (Signal line) as EMA applied to TII
- Signal Line = EMA(TII, k)
Here k is the bar period of EMA applied to TII
How to Apply the Trend Intensity Index Indicator to Charts?
On Zerodha Kite
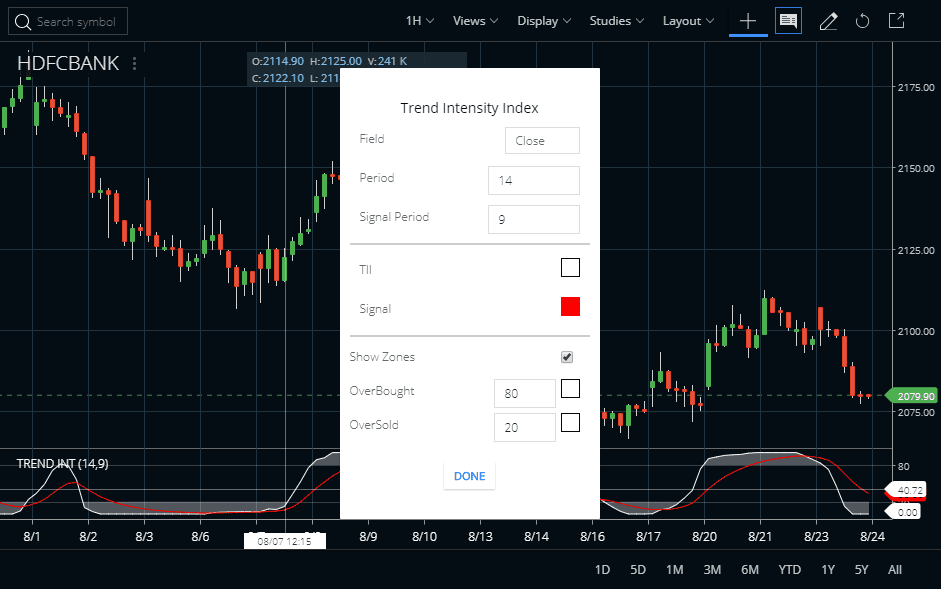
If traders can know more about the TII indicator, then they can find it in the STUDIES section of Zerodha Kite. It is also available in Kite Mobile App. The default Field is Close and you can set this to open, High, Low, etc. The default Period is 14 and the Signal Period is 9. You can set and change these two values also. You can also check the image below to understand how to attach the TII indicator to the HDFC Bank share price chart. Use this indicator on any chart like daily time frame, weekly time frame, monthly time frame, or intraday time frame.
On Upstox Pro
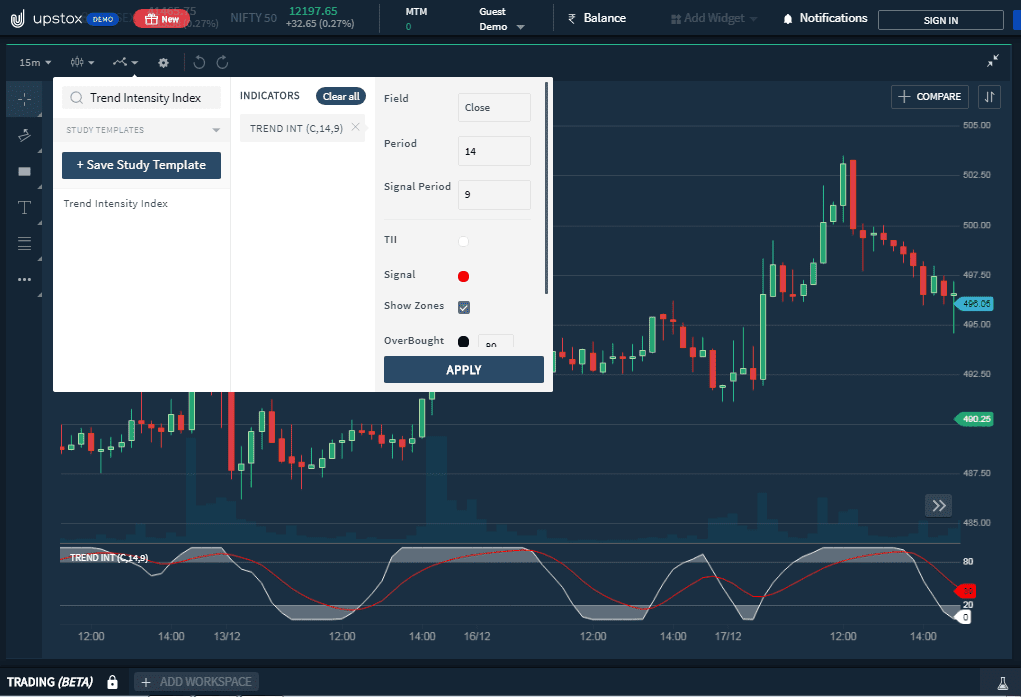
The next charting platform is Upstox Pro. Thereafter adding scripts in the market watch. Open a chart of any of the scripts. Then go to the indicator section. The indicator option will look like this. Now, put the name of the indicator in the blank space and click on apply.
Trading Strategy of Trend Intensity Index
Crossover of the 50 Mark
- The indicator ranges from a lower limit of 0 to an upper limit of 100
- A TII value above 50 signals a growing uptrend
- On the other side, a TII value of 80 indicates that 80% of the total deviations are up.
- Once TI Index falls below 50, a downtrend is likely in place.
- There 50 represents a level that is trend-neutral.
- The closer the indicator is to 100, the stronger the current uptrend is.
- The closer value of TII is to 0, and the stronger the current downtrend.
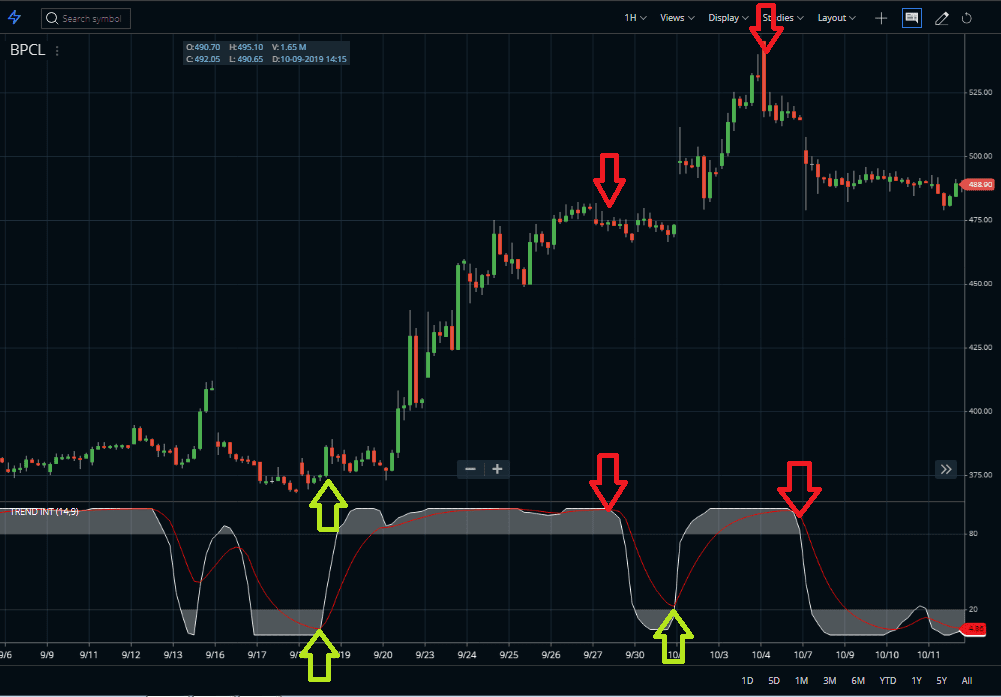
Crossover of Trend Intensity Index Indicator with its Signal Line
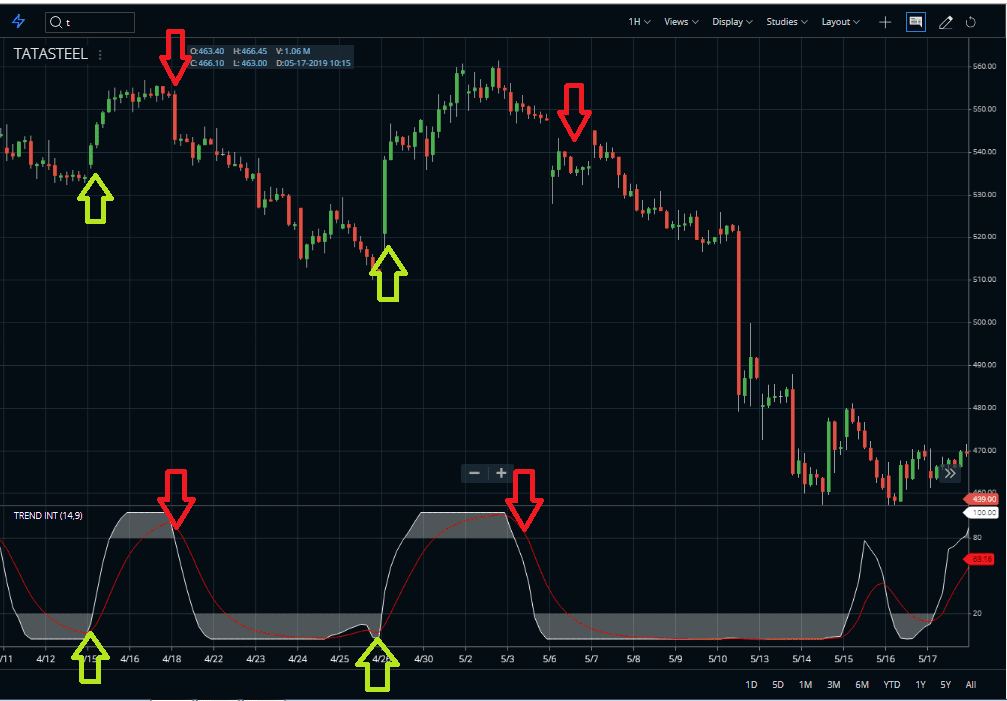
Another point is when the signal line crosses the TII line from above and it goes below it, buys signal generates. The exact opposite happens during the sell signal. Here, the red line is the signal and the white line is the FII line.
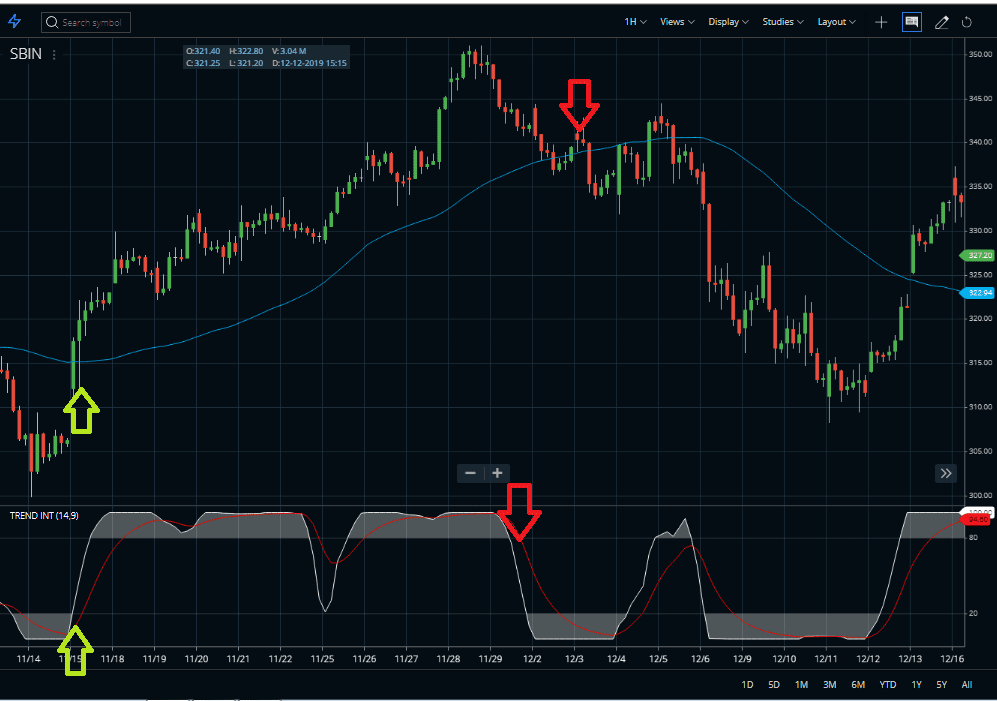
Using a Moving Average
The last strategy is with MA (moving average). Here, to avoid the extra noise of TII, I add a 50 SMA (simple moving average) with the price chart. As you can see, I enter into the buy position when the price goes above the MA line and the TII line goes above the signal line. The opposite things I do in case of a short-sell.
Conclusion:
Like other oscillators, the TII is also bounded between 0 and 100. When the indicator shows a reading above 50, this indicates a bull trend. When the TII shows a reading below 50, a bear trend is probably present. The more the distance of the Trend Intensity Index Indicator from the 50 levels, the greater the strength of the current trend. The closer the Trend Intensity Index indicator is to 100, the stronger the bull trend. The closer this indicator is to zero, the stronger the bear trend.
Thanks for developing such a nice Indicator
Very perfect indicator for getting signal of trading