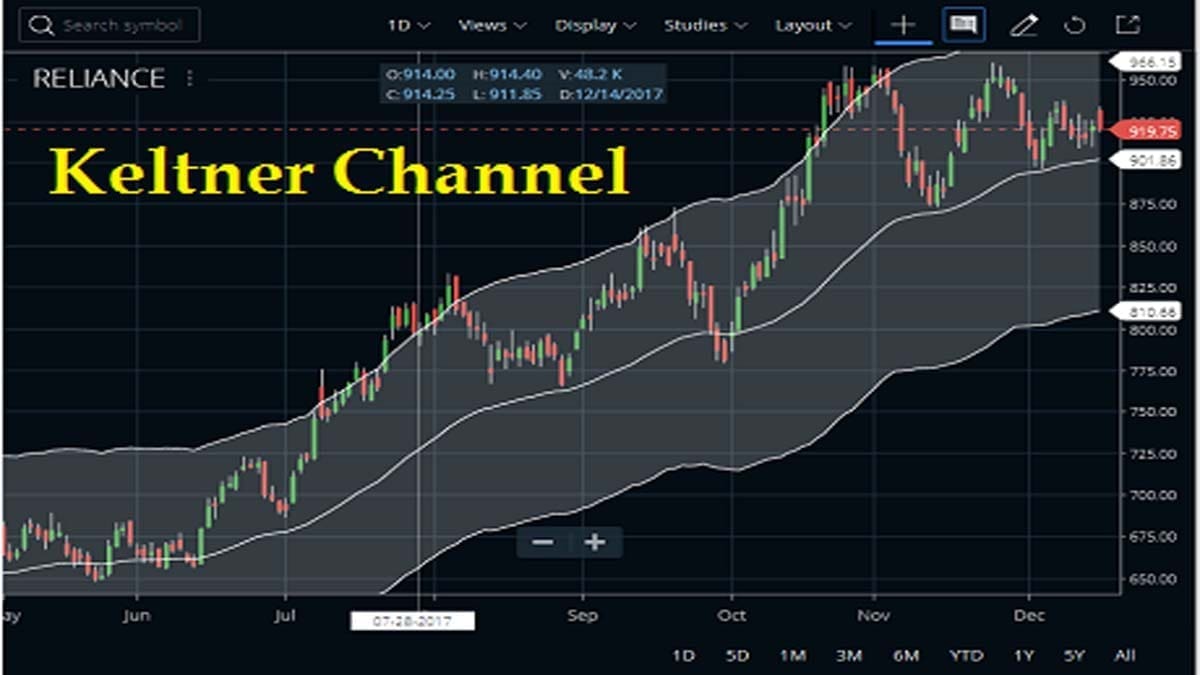
The Keltner Channel indicator is very popular among traders as a technical pointer. Traders are using this to assess the stock or commodity’s trend. It can spot potential reversal points and can also provide trade signals. It is also a volatility-based envelope set above and below an exponential moving average.
So, the indicator was first introduced by Chester Keltner in the 1960s. Linda Bradford Raschke in the 1980s updated this indicator and this later version of the indicator is the one traders now use. This indicator is useful because it can make the trend more visible.
FAQ
The calculation of Keltner Channels is a function of an MA (moving average) of the “typical price” and, a multiple of the ATR (Average True Range). You can calculate the ATR over a time period, and multiply by a multiple (typically 1.5). Here, the “typical price” is the sum of the high, low, and close divided by three.
I’ve already mentioned that KC (Keltner Channels) and Bolinger Bands have some similarities. Apart from the similarities, there are differences too. Like, Bollinger’s studies rely on the standard deviation while Keltner Channel presents volatility using the high and low prices.
The KC indicator is a trend-following tool, used to identify reversal with channel breakouts and direction. It is a volatility-based envelope set above/below an EMA (Exponential Moving Average).
What is the Keltner Channel Indicator?
In the indicator, there are three lines. The middle line is an EMA or Exponential Moving Average of the price. Here, Additional lines are above and below the EMA line. The upper band is typically set two times the Average True Range (ATR) above the EMA. And the lower band is usually set two times the ATR below the EMA. The bands expand and contract as per the volatility expands and contracts.
Generally, Keltner channels work by combining the average true range of an instrument. And, plots the multiple of the ATR above and below the exponential moving average by using bands.
Formula of the Keltner Channel Indicator
- Keltner Channel Middle Line=EMA
- Keltner Channel Upper Band=EMA+2∗ATR
- Lastly, Keltner Channel Lower Band=EMA−2∗ATR
Here, EMA (Exponential Moving Average usually 20 periods)


ATR (Average True Range period of 10 to 20)
Setting up the Keltner Channel on Charting Platforms
Now, you will get guidance on setting up the indicator on charts. To place the example, I’ve taken Zerodha kite and Upstox pro charting platforms. So, let’s start with the Zerodha kite.
Keltner Channel on Zerodha Kite
The default period of the Keltner Channel in Zerodha Kite is 50 and the shift is 5. The channels can also be used to identify overbought and oversold levels when the trend is flat. Check the image below to understand how we attached this to the Reliance Industries share price chart.
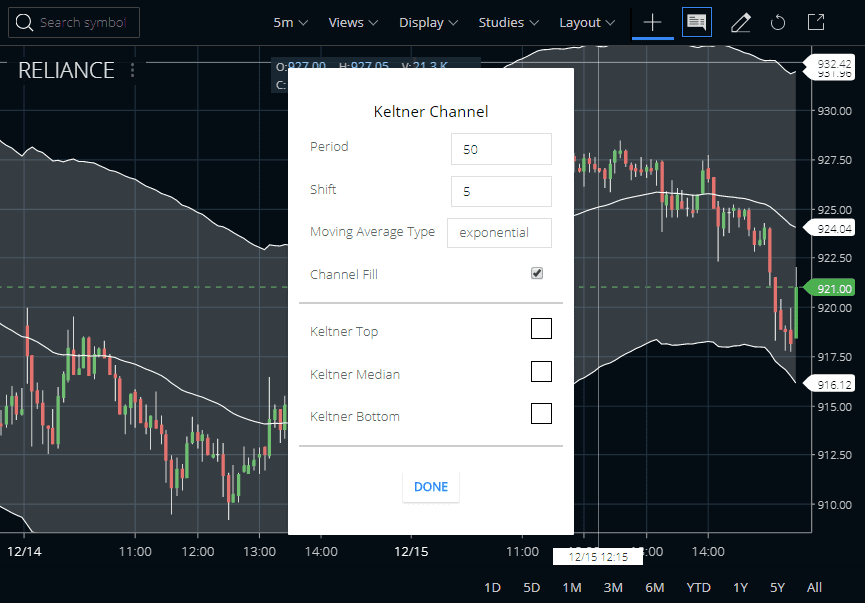
Once you click on the indicator’s name you will find varieties of customizable options such as period, shift, MA type, channel field, etc.
Keltner Channel on Upstox Pro
In Upstox Pro also, the method is quite straightforward. First, log in to your account and then select your preferred indicators.
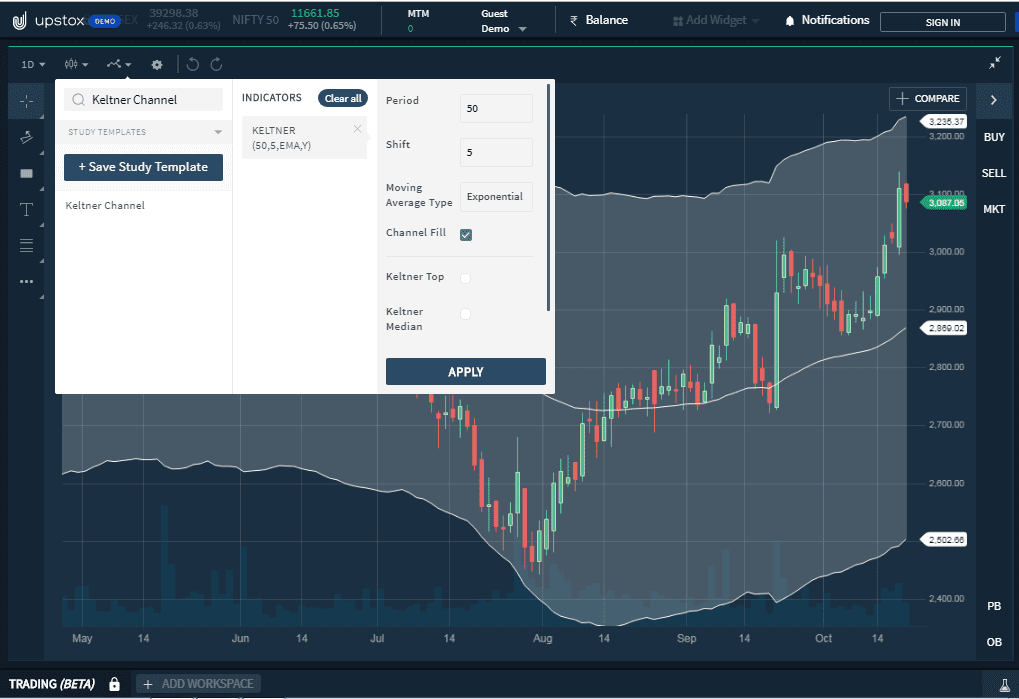
There also you can customize the color, period, shift, etc.
What are the Trading Strategies of Keltner Channel?
Simple Trading Strategy using the Keltner Channel
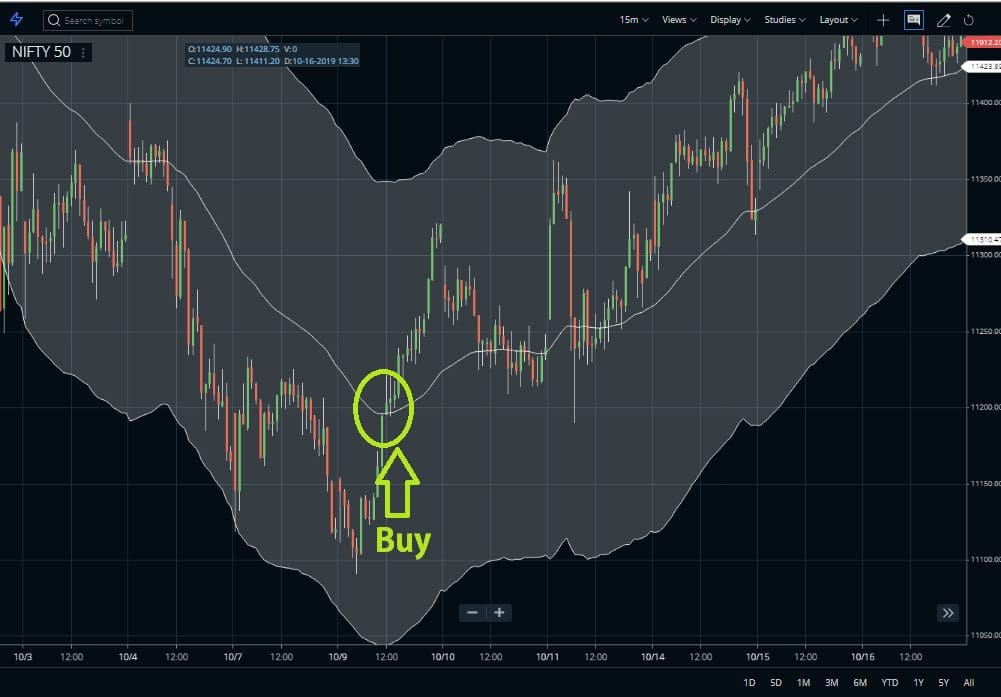
- The general strategy of this indicator is to buy during an uptrend when the price pulls back to the middle line.
- Then place a stop loss about halfway between the middle and lower band, and place a target near the upper band (stop loss and target set at the time of the trade).
How to Short Sell with this Indicator?
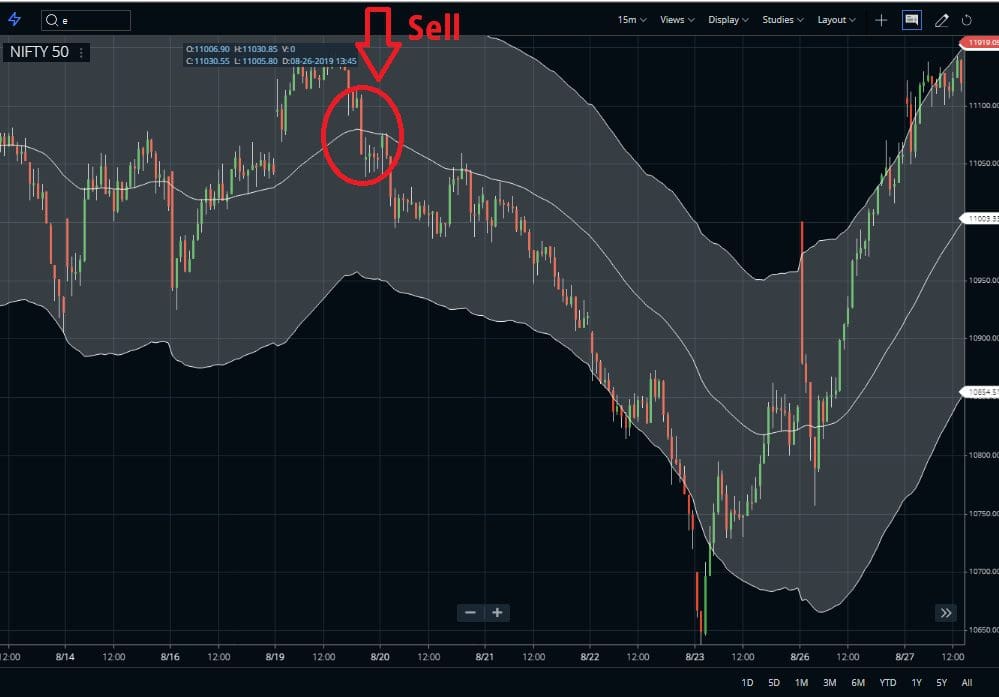
- Another is a short-sell during a downtrend when the price rallies to the middle line.
- Then place a stop loss about halfway between the middle and upper band, and place a target near the lower band.
Trend Continuation Strategy
- When a stock or commodity is trending on the upside, it should regularly touch the upper band and even move past the upper band on several occasions.
- The price should also stay above the lower band, and will often stay above the middle band or barely dip below it.
- In this indicator when a scrip is trending on the downside, it should regularly touch the lower band and even breach it on several occasions.
- The price should also stay below the upper band, and will often stay below the middle band or barely push above it.
Using Keltner Channel as Support or Resistance and in Pullbacks
- The indicator also works as the support and resistance level.
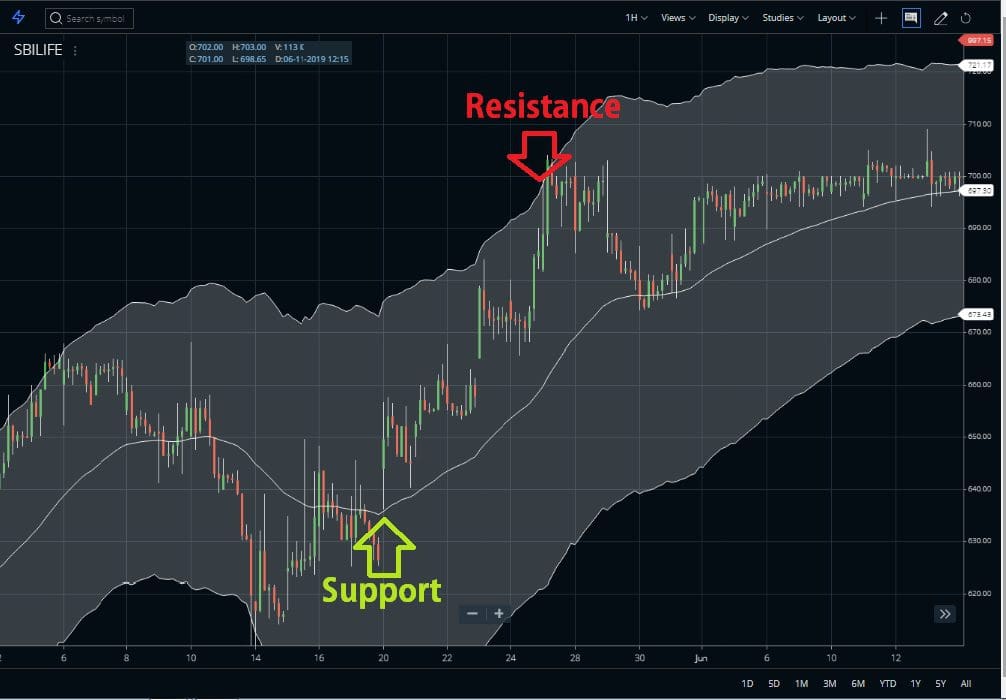
- Trading pullbacks is best done in a market that has exhibited a strong push in a direction (during a trending market). This depends on swing analysis where one wants to see the conviction in a market swing. It indicates another move in the same direction.
Conclusion :
However, Keltner Channel Indicator is a trend-following indicator in which the identification of trends is more than half the battle. The trend can be up, down, or even flat. In this indicator, traders and investors can identify the trend to establish a trading preference. Bullish trades are favored in an uptrend and bearish trades are favored in a downtrend. However, in all analyses, it is better to use the Keltner Channel indicator in conjunction with other indicators and analyses. Technical Indicators based on channels, bands, and envelopes are designed to encompass most price action. Hence, moves above or below the channel lines warrant attention because they are relatively rare.


