Earlier we covered many of our blog posts on the moving averages and its strategy. If you didn’t go through the previous posts on it, I suggest you read them once. In this context, I am going to explain a segment of the MA 200 Day Moving Average in detail. I will also show you how this moving average can make you rich easily. Here, I am also going to suggest you some stock names which currently cross the 200 moving average level. So let’s start with the basics.
FAQ
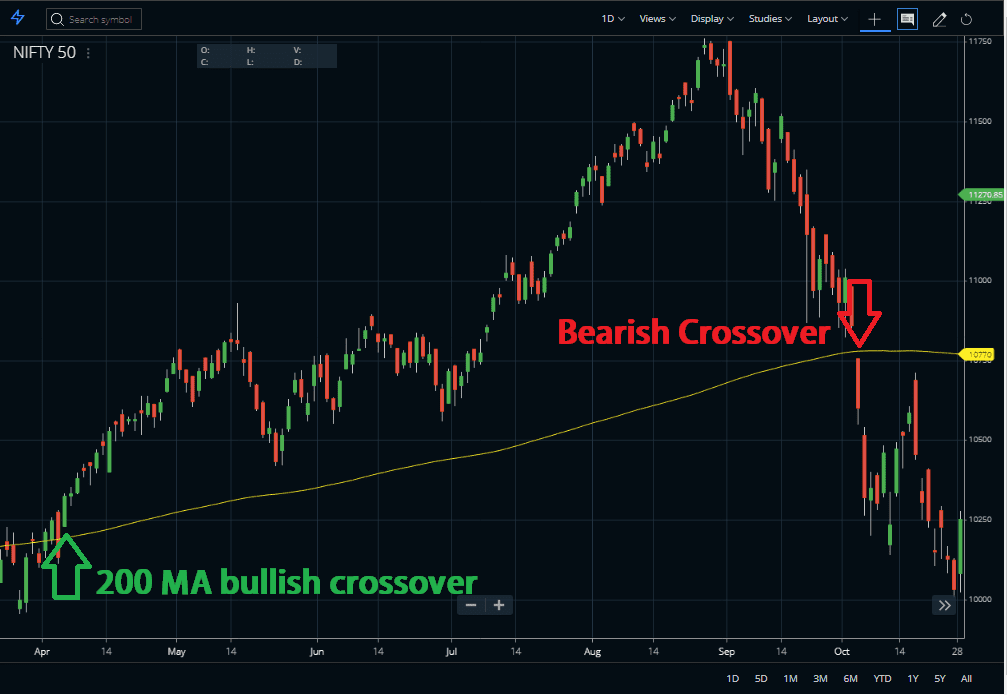
The primary strategy of the 200-day moving average is when a stock price goes above the 200-day moving average, it is bullish. Oppositely, if a share price moves below the 200 days MA, the trend is likely to be bearish.
The crossover of the 50-day and 200-day moving average is known as Golden Cross. If you see a golden cross, you should hold your position and trade until the 50 MA breaks in the downside. Here, you can put a stop loss beyond the bigger top or bottom candlestick prior to the cross.
200 DMA is generally important in defining the uptrend, the downtrend of a script. As I have told you that if the price level breaks the 200 MA line from below and goes above, the trend is up. On the other hand, when the price breaks the MA line from up and moves below it, the trend is down.
Generally, the 200-day moving average is calculated by adding up the closing prices of the previous 200 days and then dividing it by 200. So, mainly it is the average of the past 200-days closing prices of the stock.
What is the 200-Day Moving Average?
Basically, the 200-day moving average is a line that is formed by adding the averages of a security’s closing price over the last 200 days. It is one of the most popular technical indicators and helps to identify the market trend of a particular security. Generally, traders and investors like to apply the average closing prices of the previous days.
How to Plot the 200-Day Moving Average on Charts?
Now, I will show you how you can attach a 200-day MA on your charting platform. To explain the steps, I have taken India’s top 2 best charting platforms from Zerodha Kite, and, Upstox Pro.
200 Days MA in Zerodha Kite
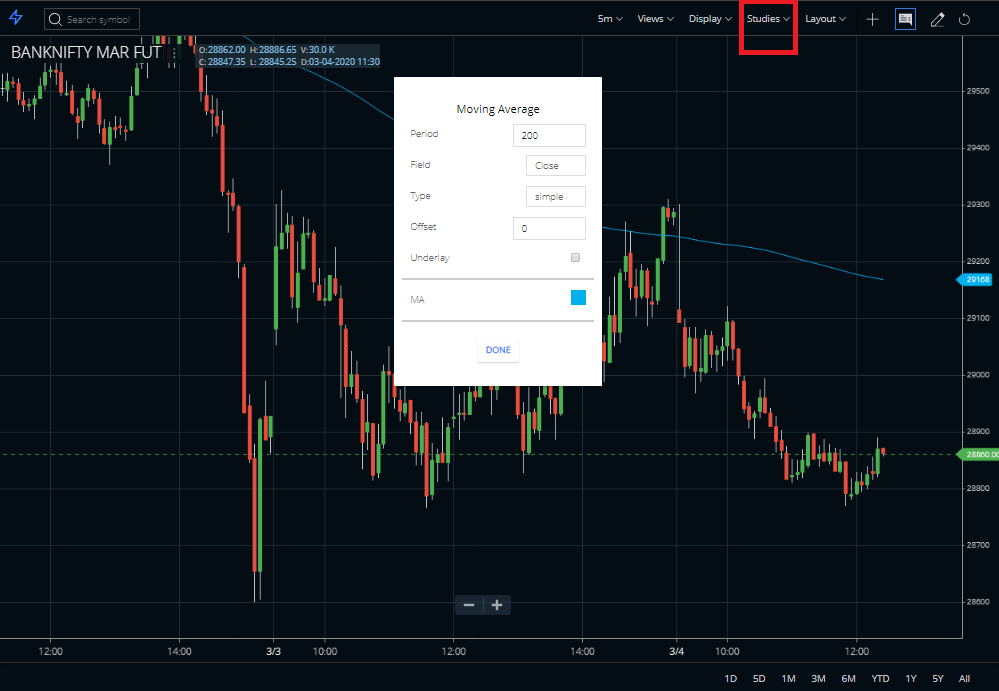
Obviously, you first need to open your Zerodha Kite Demat account. If you do not have it or if you want to open it, you can do so by clicking on the link. Then open any of your favourite security over there. For like, I open the Bank Nifty March Future. There go to the Studies section and search for a moving average. Click on it and you will get a small window like this. It is customizable. For example, you can add a period, field, type, colour, offset, etc. I add 200, field close, type simple, offset 0, underlay none, and the colour blue. After that, click on Done. Your 200 MA line will appear.






200 Days MA in Upstox Pro
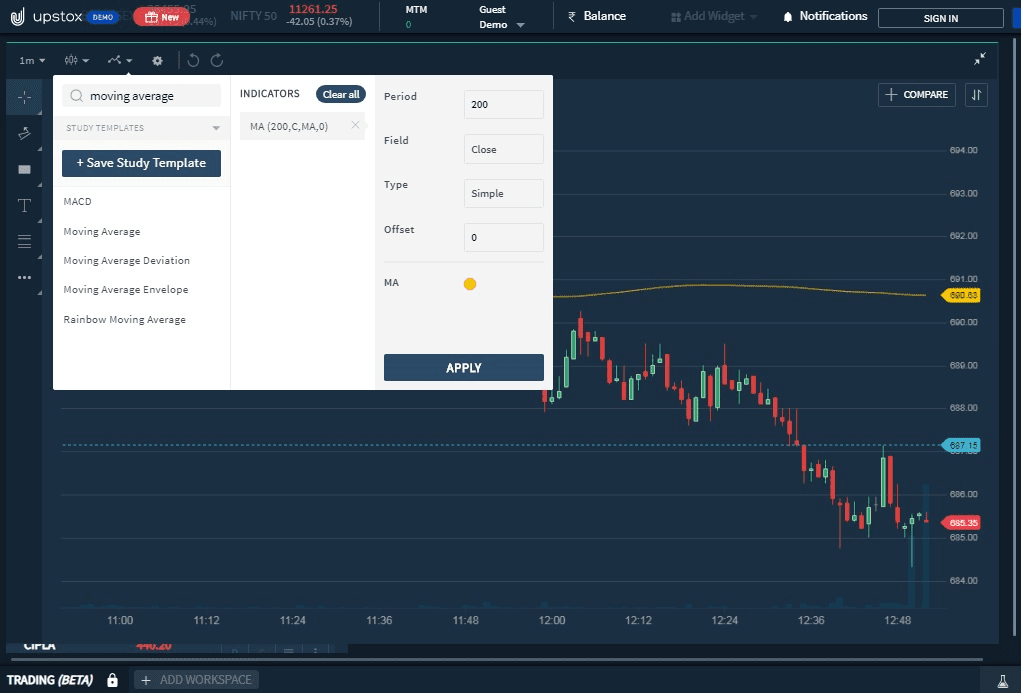
Here, also the process is almost the same. First, log in account Upstox Pro. Then open any chart. And open the indicator section. There search for the moving average. Usually, customizable options are available.
Trading Strategies Using 200-Day Moving Average?
- If the price is above the 200-day MA indicator, you must look for buying opportunities.
- Reversely, if the price is below the 200-day MA indicator, then you must look for selling opportunities.
- You can find potential support and resistance using 200-day MA.
- Try to find a support area on your chart where potential buying pressure could step in. Hence, if the price is above the 200-day moving average, this can be a buying opportunity at Support.
- You may take resistance on your chart where potential selling pressure could step in. Here also, if the price is below it, this can be selling opportunities at Resistance.
- Sometime you’ll notice the price bounce approach of the 200MA. And this gives you an opportunity to enter the markets.
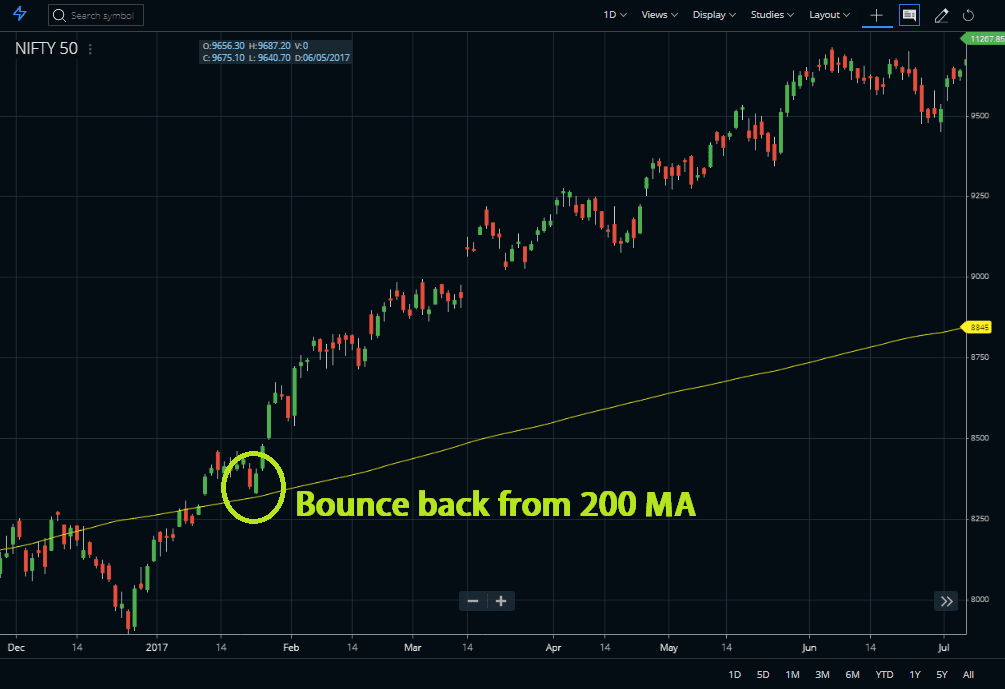
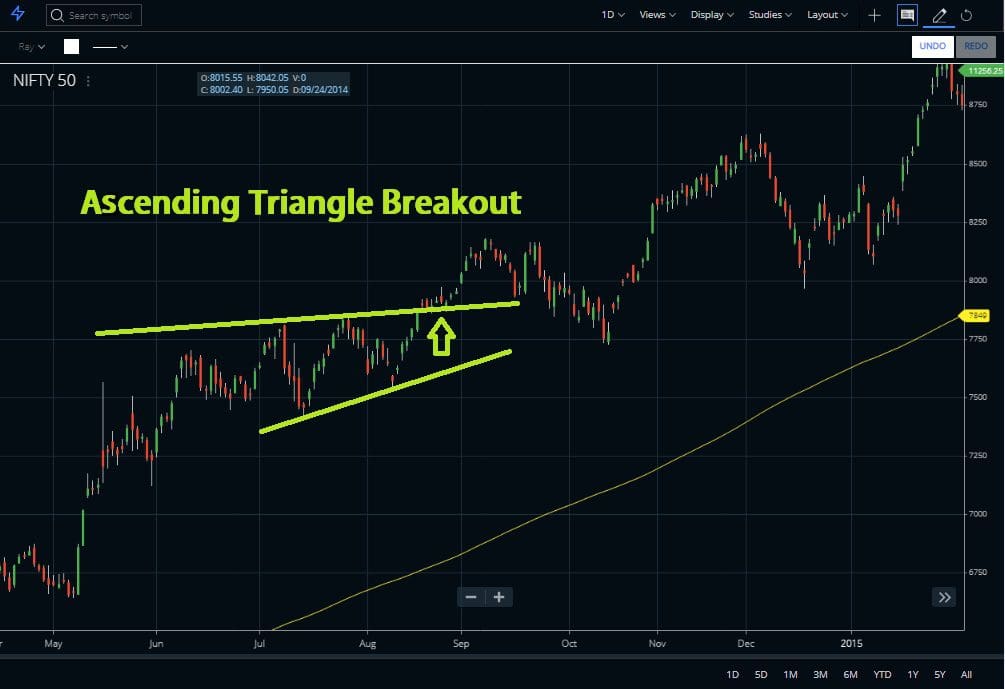
- In an uptrend (if a share price is above 200MA), you can obviously look for an Ascending Triangle and buy the breakout.
- Reversely, And in a downtrend, look for a Descending Triangle and short-sell the breakdown.
Live Examples of 200 MA Strategy
This is the daily chart of Nifty. Instead of the normal candlestick, here I use Heikin Ashi. I decided to use this charting tool as Heikin Ashi is much more clear and more noise-free compared to the normal candlestick.
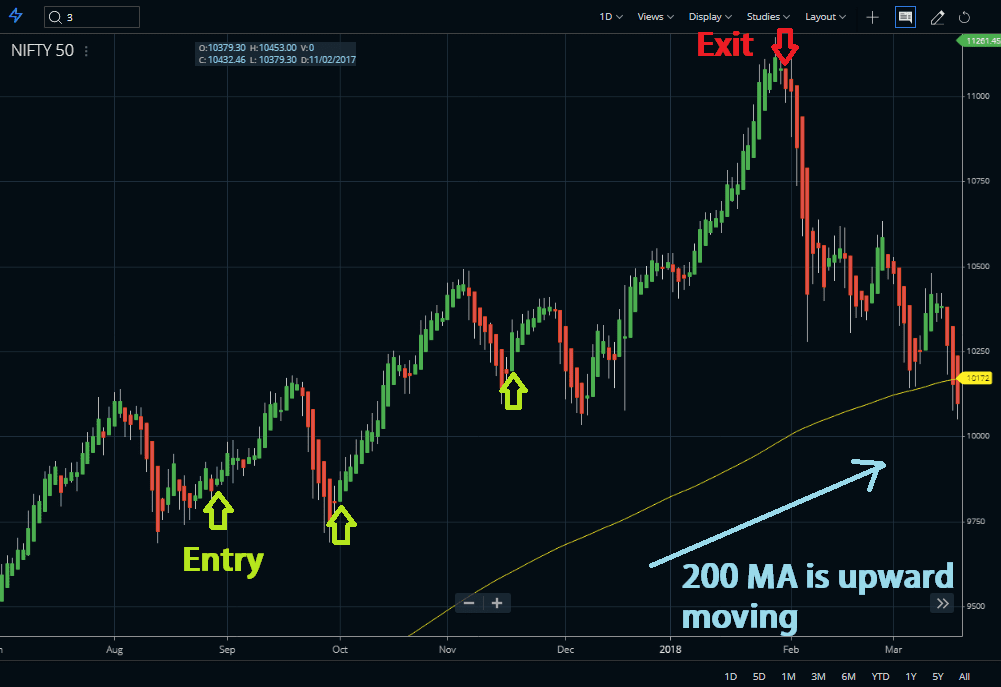
Now, have a look at the above image. Here, I add 200 days MA. Now see, here I identify three entry points where a bullish candle appears without a lower tail and confirms the bullish trend further. And do not exist until a red candle without a lower tail confirms the bearish trend. Here, one more thing is important, you must have a close look at the slope of the MA. In the chart, as you can see the MA slope is in an upward direction. That means the price is likely to move up.
Golden Cross Strategy
For the golden cross strategy, you need to plot 50 MA and 200 MA together on a chart. here, the yellow line is 200 MA and the blue line is 50 MA. Now, let’s look at the strategy.
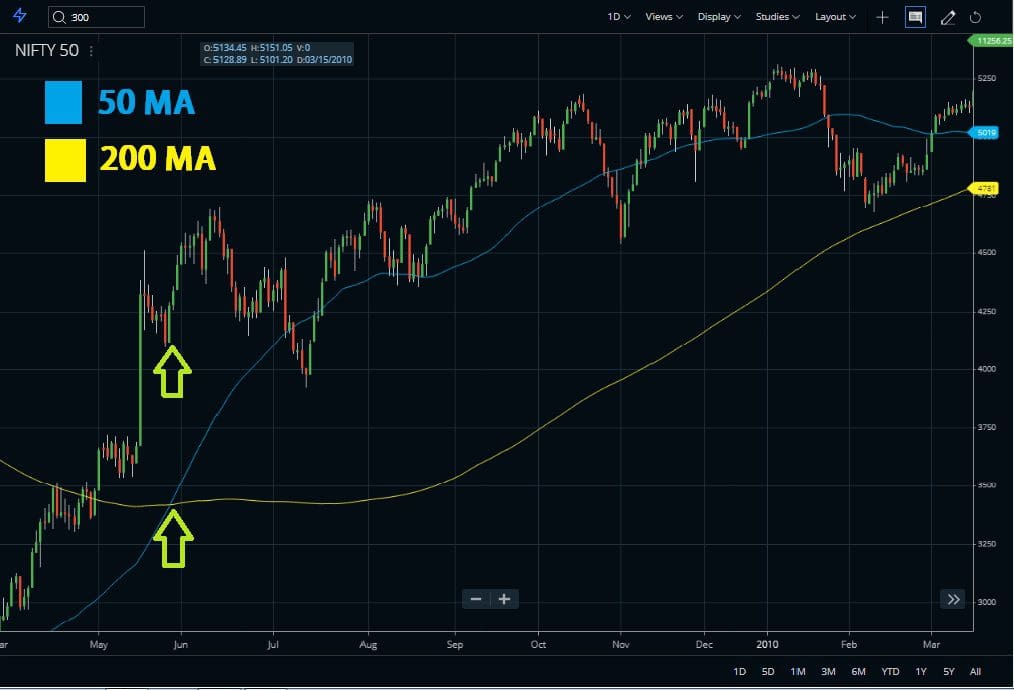
When the 50 MA crosses the 200 MA from below and moves upward, you can assume that the price will go up. Oppositely, when the 50 MA crosses the 200 MA from above and goes below, the trend is about to down. Now, see the above picture. Thereafter the golden cross of 20 and 200 MA, Nifty rallied a lot, almost about 1200 points within a few months. Though in between those months, the graph showed ups and down movement, the 2 MA helps to overlook the noise very much.
Recent Stock List Crossing 200-Day Moving Average (06/06/2024)
Follow the above stock list, there you will find some stocks’ recent crossover of 200 MA.
| Sr. | Stock Name | Symbol | % Chg | Price | Volume |
|---|---|---|---|---|---|
| 1 | RattanIndia Enterprises Ltd | RTNINDIA | 11.51% | 77 | 7,698,837 |
| 2 | Affle India Ltd | AFFLE | 6% | 1172.55 | 527,576 |
| 3 | Narayana Hrudayalaya Ltd. | NH | 5.8% | 1253.4 | 558,455 |
| 4 | Fertilizers And Chemicals Travancore Limited | FACT | 5.3% | 690.8 | 241,093 |
| 5 | Adani Energy Solutions Ltd | ADANIENSOL | 5.22% | 1001.35 | 4,163,264 |
| 6 | Alok Industries Ltd | ALOKINDS | 4.93% | 25.55 | 2,464,660 |
| 7 | Motherson Sumi Wiring India Ltd | MSUMI | 4.44% | 67 | 5,787,162 |
| 8 | Pnb Housing Finance Limited | PNBHOUSING | 4.14% | 742.65 | 491,785 |
| 9 | Graphite India Limited | GRAPHITE | 3.94% | 560.4 | 455,016 |
| 10 | Aptus Value Housing Finance India Ltd | APTUS | 3.93% | 314.4 | 428,515 |
| 11 | Mahindra Lifespace Developers Limited | MAHLIFE | 3.81% | 575.4 | 389,333 |
| 12 | Welspun Corp Limited | WELCORP | 3.51% | 509.9 | 900,676 |
| 13 | Poonawalla Fincorp Ltd | POONAWALLA | 3.42% | 450 | 660,369 |
| 14 | Mphasis Limited | MPHASIS | 3.4% | 2442.5 | 264,348 |
| 15 | Bayer Cropscience Limited | BAYERCROP | 3.05% | 5450.05 | 10,192 |
| 16 | SBI Life Insurance Company Ltd | SBILIFE | 2.41% | 1423.65 | 771,452 |
| 17 | C.E. Info Systems Ltd | MAPMYINDIA | 2.14% | 1952.7 | 30,597 |
| 18 | Deepak Nitrite Limited | DEEPAKNTR | 1.88% | 2270 | 151,346 |
| 19 | Metro Brands Ltd | METROBRAND | 1.54% | 1162 | 69,459 |
| 20 | Dr. Reddy’s Laboratories Limited | DRREDDY | 1.05% | 5885.1 | 332,644 |
| 21 | ICICI Securities Ltd | ISEC | 0.42% | 712 | 249,766 |
Conclusion
If you follow this strategy, I am sure you will be benefited from it. This 200 MA is super beneficial for investors. By applying this single tool, you can fix entry-exit points of shares easily. For more such an accurate strategy keep an eye on our blog post and stay updated.