
If there is a system that can make money for you while you are busy with some other work. You can be working in an office, or you can be doing some business, but if you can follow a really good trading system that is profitable in the long run, you can make huge money even working just 15 minutes a day. Today I will show you how to earn nearly Rs. 5 Lacs every year from a Bank Nifty positional trading system.
Features of this Positional Trading System
No need to follow the market every time, just enter at the market close or the next day open, hold the trade for a few days or weeks as the system suggests, and then exit when the system generates an exit signal for you. No need to know any technical analysis, no need to watch the TV, and no need to count sleepless nights while you are on trade. Profits can be made if you follow a simple system strictly.
Why the Bank Nifty?
Bank Nifty is much more volatile than the Nifty index. So the swing in the Bank Nifty index can be much more offering you more profits per trade. But remember one thing, handling this volatility also requires a sound trading mind. Hence traders must need to keep their heads calm while in a position.
Why a Positional Trading System?
In a positional trading system, you need not watch the market every time. Positional traders or delivery traders do not require full-time involvement like day traders. You can do your full-time job and still earn a handsome income from Bank index trading.


Tools Required:
We used Amibroker and Trend Blaster Trading System and used it on Bank Nifty daily charts. So if you are trading the daily charts, even no need to purchase any costly data for Amibroker. You can even use GetBhacCopy to download the end-of-day data for Amibroker.
Test of the Bank Nifty Positional Trading System:
We attached the Trend Blaster charts on the Bank Nifty daily charts. The default value of A in Trend Blaster is 20, while trading on the daily charts we will change it to 3. See the image below:
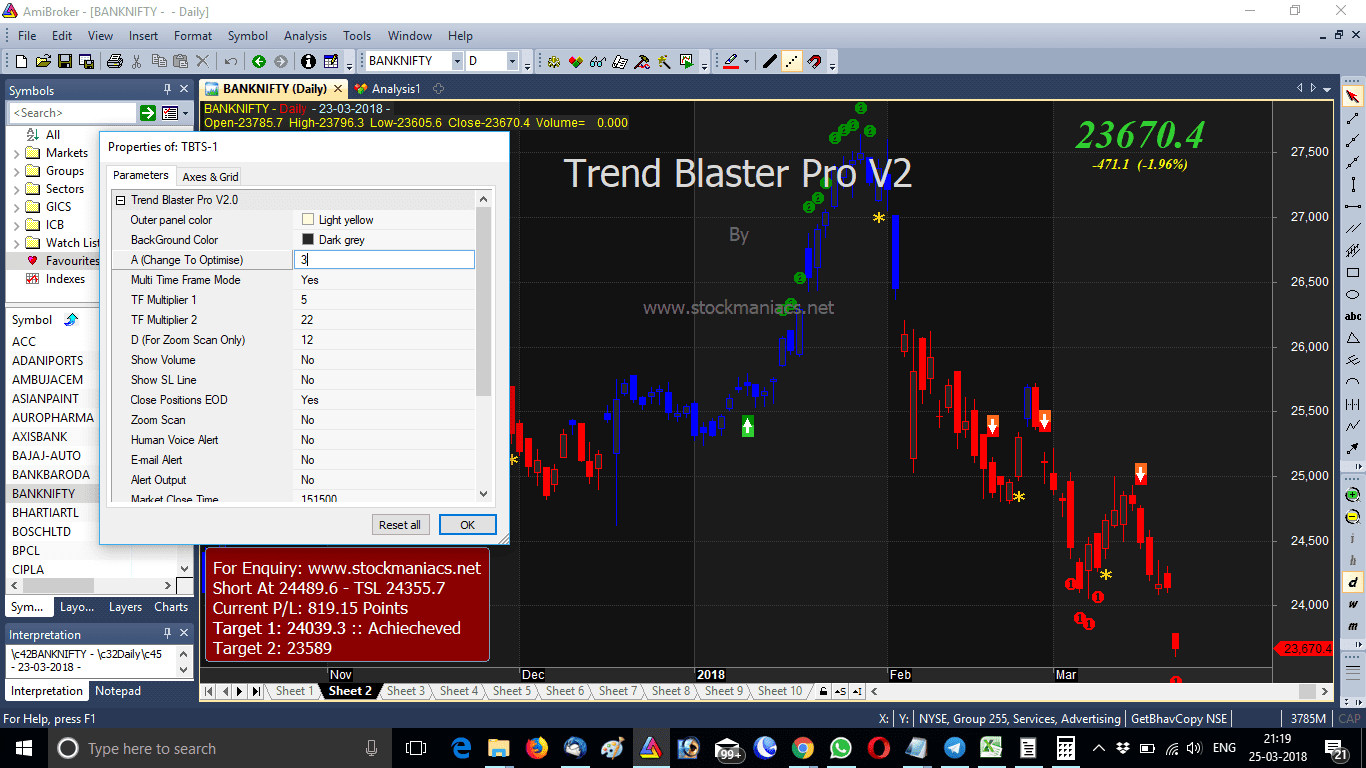
The system works really simple. When a buy signal (green up arrow) comes to buy the Bank Nifty future next morning. When a buy exit signal (golden star) comes to exit the buy the next morning. Similarly when a short sell signal (red down arrow) comes short sell the Bank Nifty future the next morning and when a cover short signal (golden star) comes to exit the short the next morning. If you have a live data feed for Amibroker, you can even change the time frame to daily, and instead of the next morning, execute the orders the same day just before the market closes.
Results of the Trading System
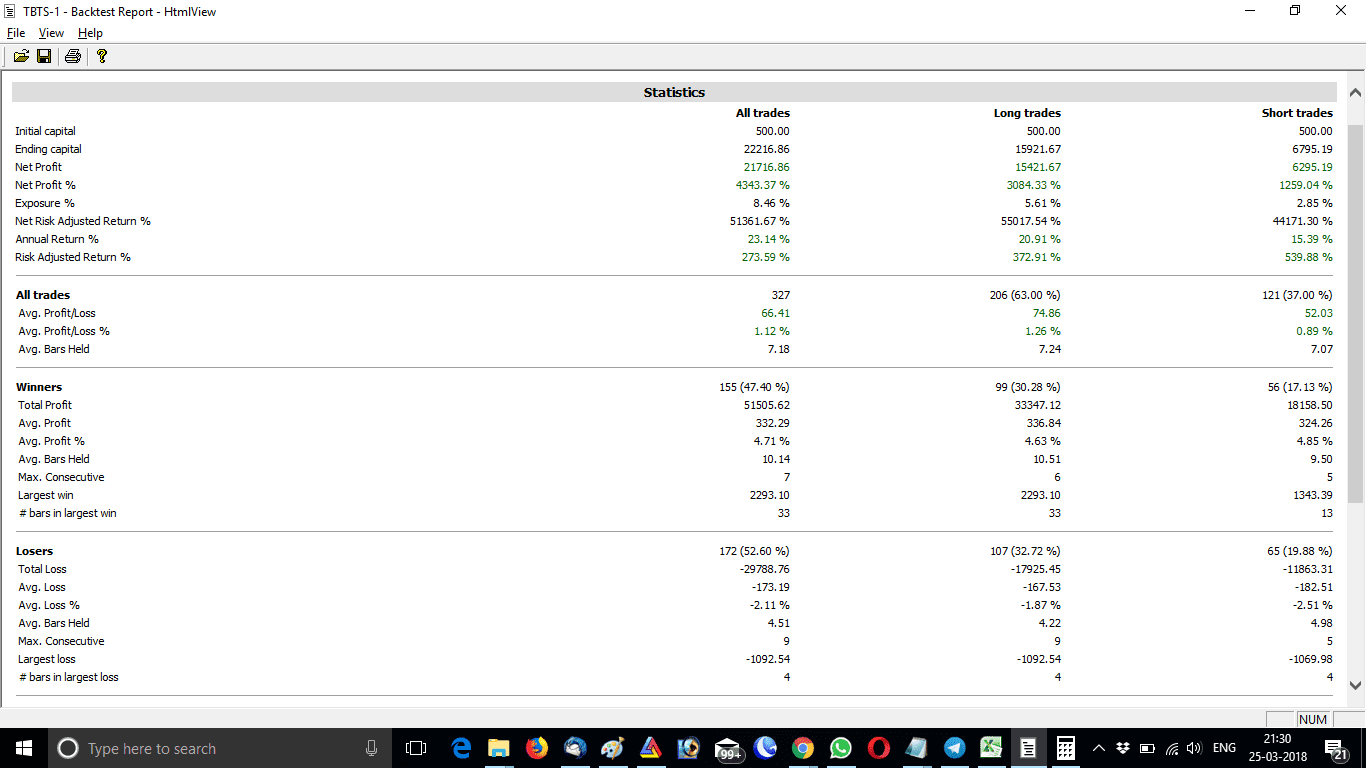
Now let us check how the Bank Nifty positional trading system performed over the past years. I have data from 2000, so tested in backtest mode. My initial capital was Rs. 500. And in the last 18 years, the capital has increased to Rs. 22216.86. We traded only 1 contract every time to understand how many points is earned. It’s a profit of 21716.86 points in the last 18 years and 3 months. So a profit of 1190 points yearly.
What is the Profit Potential?
At the current Bank Nifty futures lot size of 40, 1190 points per year can fetch 1190 x 40 = Rs. 47600 per lot. If a trader can trade at least 10 lots, i.e., 400 Bank Nifty, he can easily earn 1190 x 40 x 10 = Rs. 4,76,000 per year. As per the current Zerodha margin, a trader needs only Rs. 9,70,636 margin for trading 10 lots on NIFTY. So it’s a 49% return on investment. If you calculate some extra margin for drawdown then also you can earn well over 25%-40% yearly.
How to Get this Bank Nifty Positional Trading System?
Trend Blaster Trading System was our flagship trading system. We sold it to small traders from 2011 till 2020. But after the covid-19 lockdown, we have discontinued this trading system, as all good things must come to an end. However, we may re-introduce the same later in the TradingView platform.
Conclusion
Positional trading has an edge over intraday trading because it requires less involvement from the trader’s point of view. However, you need to follow a really good trend-following system and stick to it to make profits in the long term. Sticking to a system is the main key to success.


Sir,
Couple of points to mark.
1) As the entry is next day open, i am sure the slippage would be huge. trading 10 Lots at open quite impossible. Do consider the slippage.
2) In the report, Largest win was till 33 bars, max trade it can go is till 25-28 bars.as per the monthly settlement.