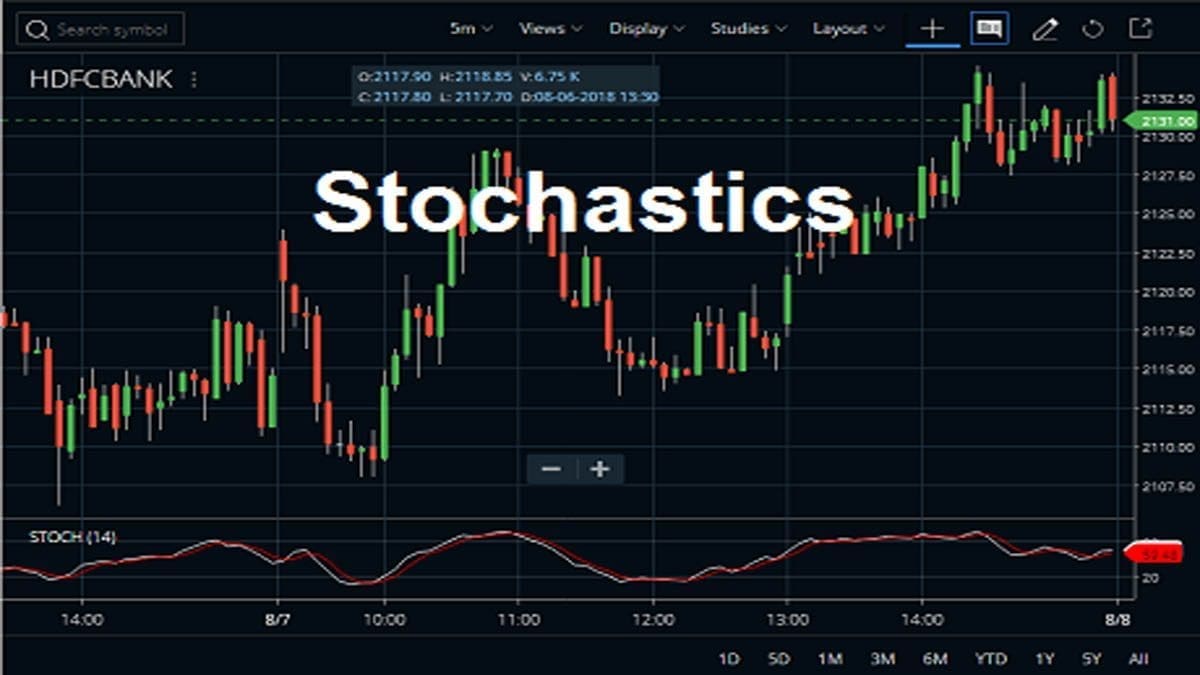
Stochastics Indicator or also known as the Stochastics oscillator is a momentum indicator. It shows the location of the close relative to the high-low range over a set number of periods. In the late 1950s, George C. Lane developed this indicator. This indicator follows the speed or the momentum of the price and the momentum changes direction before the price. This was Lane’s first and most important developed indicator.
What is the Stochastics Indicator?
The Stochastics Indicator compares an asset’s closing price with its range over a given period of time. Tracking these fluctuations, enables investors to detect when a momentum shift has begun, helping them recognize both potential rallies and periods of stagnation or reversal. This technical indicator is useful for identifying overbought and oversold levels. It is also a highly popular technical indicator that is used by traders all over the world. The Stochastics is actually an oscillator, i.e., it oscillates between 2 values. Stochastics Oscillator oscillates between the value of 0 and 100.
How to Attach the Stochastics Oscillator to the Charts?
The traders can know more about Stochastics in their terminals.
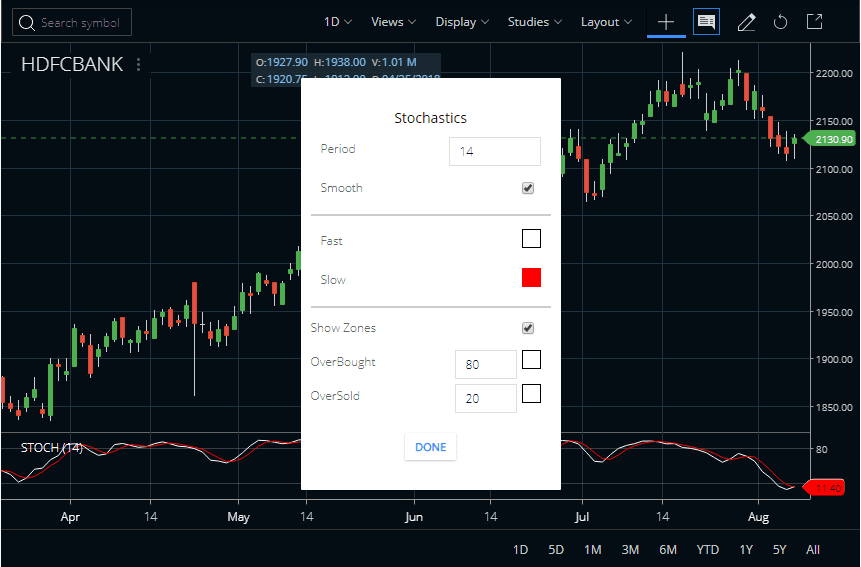
On Zerodha Kite
They can find it in the STUDIES section of Zerodha Kite and it is also available in Kite Mobile App. The Period is 14 and you can set the value of it high and low. You can also check the image below to understand how to attach the Stochastics indicator to the HDFC Bank share price chart. In this indicator on to any charts like daily, weekly, monthly, or intraday you can attach.
On AmiBroker
Similarly, we can attach the Stochastics to other charting platforms like AmiBroker. In the AmiBroker platform, there is no readymade AFL formula code for the Stochastics. Hence, users need to drag and drop %K and %D to an empty chart pane to see the full indicator.


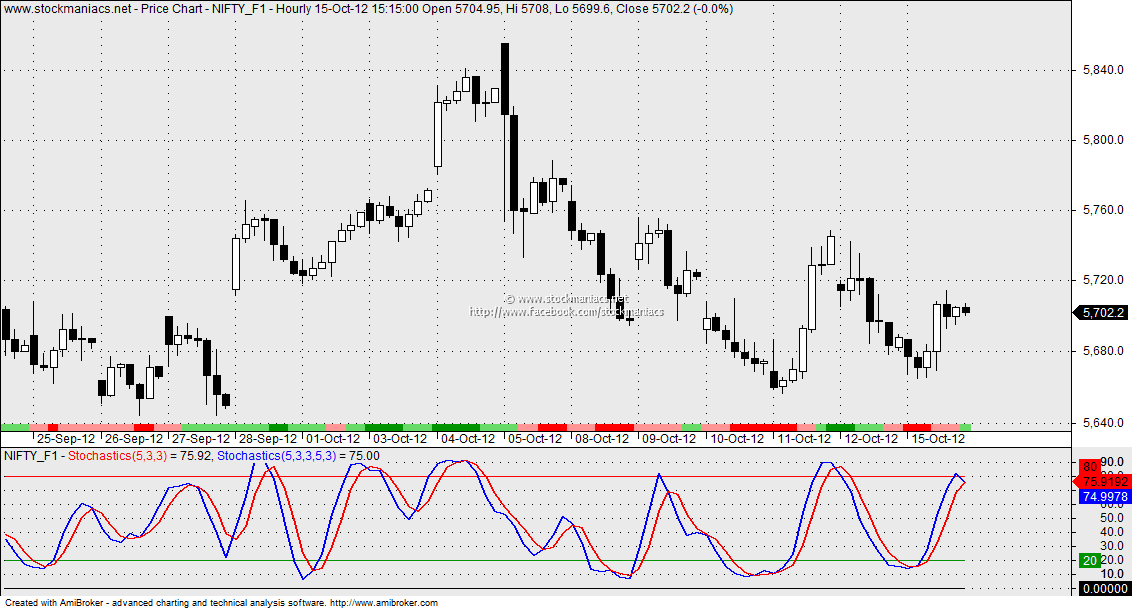
But here we provide you with a ready-made AFL code for the Stochastics Indicator. You can copy it from below and paste it into your AmiBroker’s formula editor.
Calculation of Stochastics Indicator:
- Stochastics oscillator is a momentum indicator that measures the level of closing prices relative to their historic highs and lows. It is calculated using two lines, %K (the fast line) and %D (the slow line).
- %K = 100 * (Current Closing Price – Lowest Low)/(Highest High – Lowest Low)
- The lowest low is the lowest price over a defined number of periods, usually 14 days.
- The highest high is the highest price within that same period. Once %K has been calculated it can then be smoothed with an average formed from a 3-day simple moving average (%D).
- The 3 day simple moving average (%D) formula looks like this: %D = 100*(3-Day Simple Moving Average Of %K/3)
Usage of Stochastics Indicator:
Now let us discuss how to trade with the Stochastics Oscillator.
As an Overbought Oversold Indicator
- The major usage of the Stochastics Indicator is to identify the overbought and oversold condition of the market.
- Most traders use this indicator on the basis of the crossover of %D and %K.
- %D crossing above %K is considered as a buy signal and %D crossing below %K is considered as a sell signal.
- Few traders also use this indicator on the basis of divergence signals.
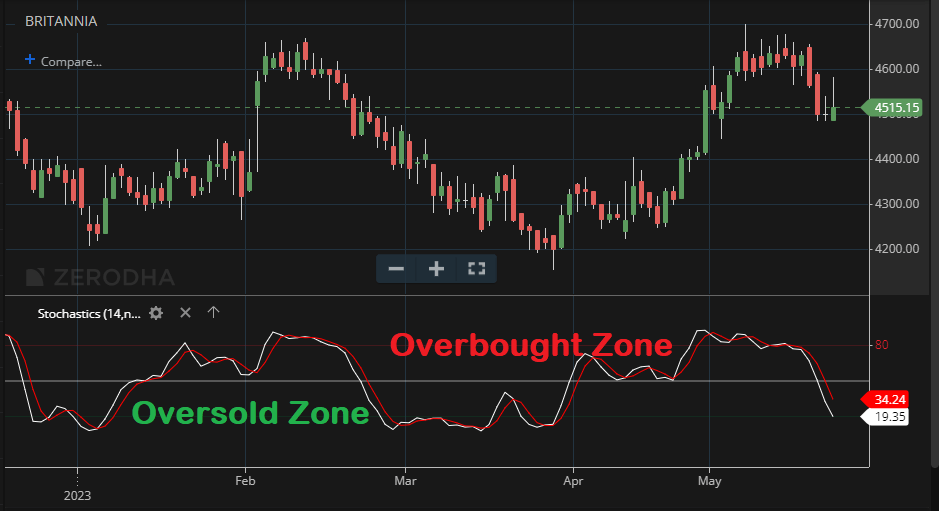
The traders consider a Stochastics value of close to 0 as oversold, i.e., the market is enough sold and can bounce back any time. Whereas they consider the Stochastics value of close to 100 as overbought, i.e., the market is enough bought and can take a correction any time. In the Zerodha Kite, the default value of overbought is 80 and that of oversold is 20.
Signal Generation from %K and %D Line Crossover
The Stochastic Oscillators have 2 lines (%ok) and (%d). The 2 lines cross each other and we consider this as the buy/sell signal. We call the %k line crossing the %d line above the buy signal. Whereas we call the %k crossing the %d line below as the sell signal.
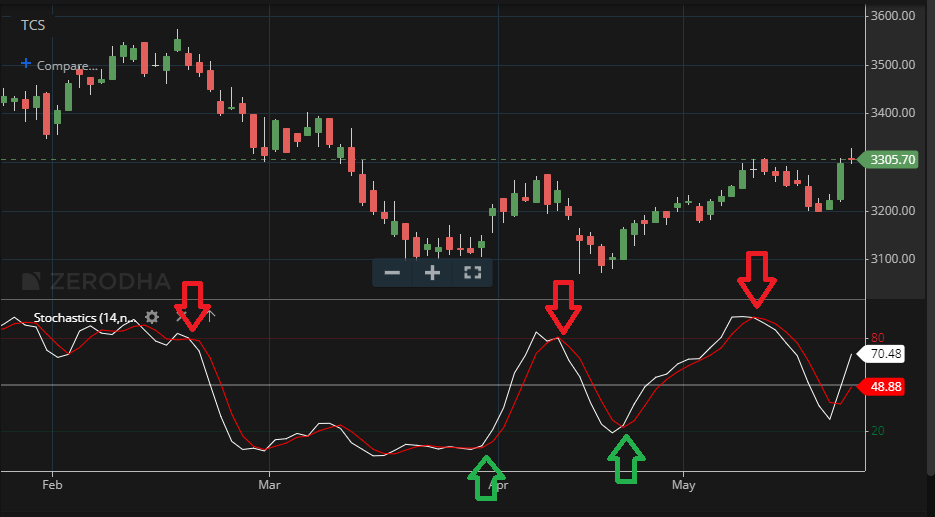
The buy signals are best when crossing 20 from below and the short selling signals are best when crossing 80 from above.
Multiple Ways to Trade the Stochastics Indicator
Some traders trade on the basis of overbought/oversold. The other school of thought is stochastics can remain in the overbought or oversold region for a long time. So some traders enter long in the overbought value of the stochastic oscillator while they short-sell on the oversold.
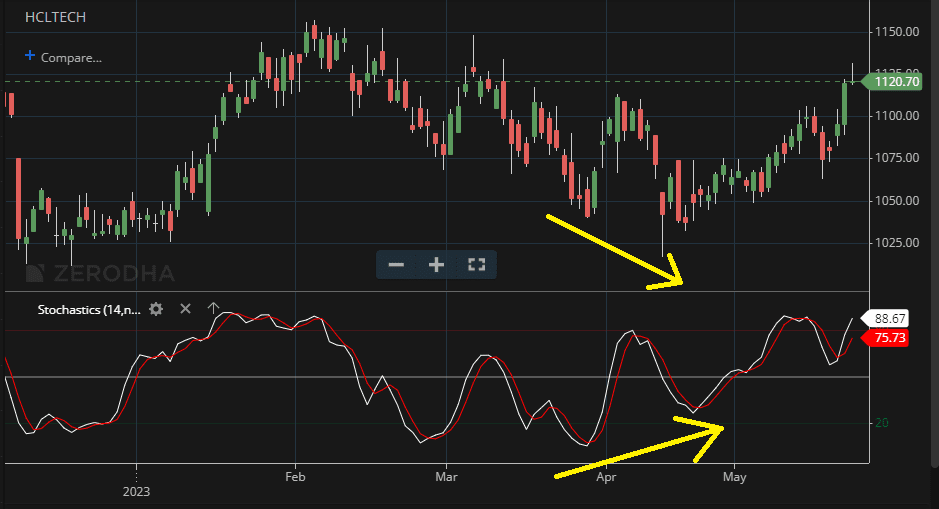
Trading the Divergence
Some traders trade on the basis of %d and %k line crossover alone. But this is not a very reliable method of trading. Another way of trading stochastics is to trade the divergence, i.e., when the price and stochastics show a divergence (suppose the price makes a lower low but stochastics makes a higher low). This denotes that the price can reverse back soon.
FAQ
Stochastic indicators are technical analysis tools that measure the degree of change in price movements. They help traders identify trend reversals and entry points for potential trades.
Overbought and oversold signals, help traders to identify trends, potential buy/sell opportunities & support/resistance levels.
The two parameters used with this indicator (the %K line and %D line) indicate buying or selling pressure which allows traders to gauge current momentum along with decisions on when to open/close positions.
Both provide information that can be used together to make informed trading decisions, but they both have different uses – MACD provides more information about momentum while Stochastics gives indications of strength or weakness over time. It ultimately comes down to preference as both can deliver success in stock trading if correctly applied
Conclusions:
Stochastics is a favorite indicator of some technical analysts because of the simplicity of its usage and also the accuracy of its readings. This indicator is easy to perceive by seasoned veterans and new analysts. It tends to help all investors make good entry and exit decisions on their holdings. We can also use this indicator to identify turns near support or resistance.


