
In this article, I will show you almost a holy grail to trade NSE Option Chain data. You can trade this strategy with above 85%-90% success rate positionally. Today I will discuss how to generate intraday as well as delivery futures and options calls using a simple trick called Put Call Ratio and I will show you the usage of the Nifty Put Call Ratio.
What Is Put Call Ratio or PCR?
The Put Call Ratio is one of the most important metrics for derivatives traders (PCR). If you look at the name, it is the ratio of the puts to the calls. We’ll look at this aspect in more detail later on. There is a bigger question: How do you find a stock’s put call ratio? Put Call ratio charts are also very important because they show how the market is likely to move. Most traders use PCR to figure out the direction of the market.
The put-call ratio (PCR) is a number that tells you how many people are willing to buy a stock. It looks at how many put options there are open at the same time as call options. There are 2 types of PCR.
PCR (OI)
OI PCR = Put open interest on a particular day / Call open interest on that same day.
PCR (Volume)
Volume PCR = Put volume on a particular day / Call volume on that same day.
How do NSE Option Chain and PCR Work?
Now, open interest in options is the value of all the positions that are open in the market. PCR can also be thought of in terms of how many times it happens in a day. While OI is about the total open contracts, volumes are about the flow of money in the market. One of them is usually more important than the other, but traders use both. The PCR (OI) usually gives us more information about market trends, and we use PCR (Volumes) to confirm what we learned from the PCR (OI).
The PCR of open interest and volume can be calculated for individual stocks, indices, and the whole market. Traders can do that for stocks, indices, and the whole market. Of course, PCR only applies to stocks that can be traded on the F&O and not to stocks that can’t be traded on the F&O. In addition, PCR is more important when the contract has been liquid for a long time. Based on sudden surges in volume, it can be hard to figure out how much PCR you need to do to get the results you want.
Calculation of Put Call Ratio from NSE Option Chain
The calculation of PCR for volumes and for open interest is very easy, and it doesn’t take very long. When you think about PCR, keep in mind that it also takes into account a specific strike. Look at PCR first.


So, let’s say there are 90,000 puts and 1,25,000 calls in the Nifty 17,700 strike at that strike price for the same expiration date. Then, in that case, PCR = 90,000 / 125,000 = 0.72
How to get Put Call Ratio from NSE Option Chain?
Go to the NSE India website and open the NSE Option Chain page there. You will see a table like the below image.
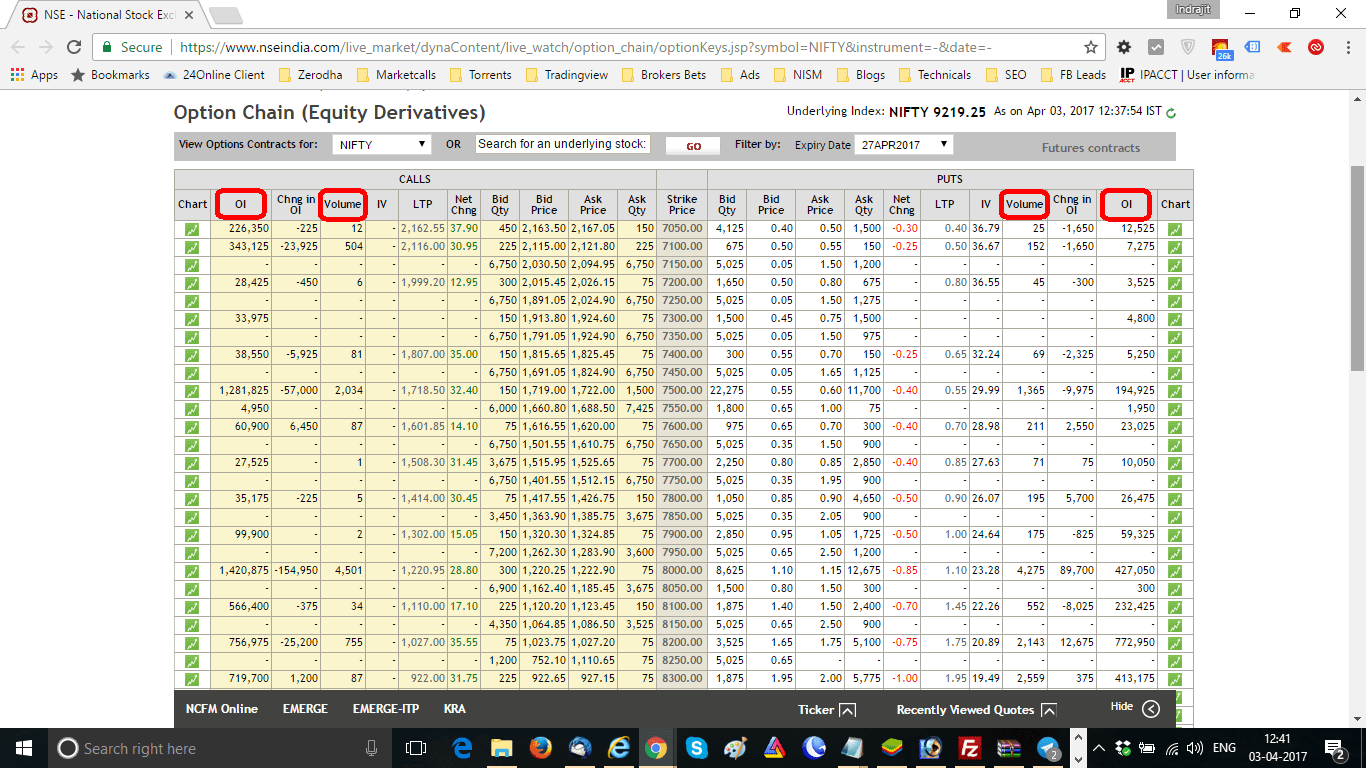
This will open the NSE Option Chain. In the options chain, we are only concerned about 2 columns. The call option open interest and the call option volume and the put option open interest and the put option volume. You can calculate Nifty Put Call Ratio based on both open interest and volume as discussed above.
How To Trade Using Nifty Put Call Ratio?
PCR close to or above 1.3 denotes that there much more puts in the system than calls. When there is huge put standing in the market it means almost all traders are with puts. No one to buy new puts so it’s almost a market bottom. Start buying calls now.
Similarly, PCR close to OR below 0.65 denotes that there are much more calls in the system than puts, and it’s time for a downside reversal. However, in extreme cases, PCR can be much higher than 1.3 and much lower than 0.65 also.
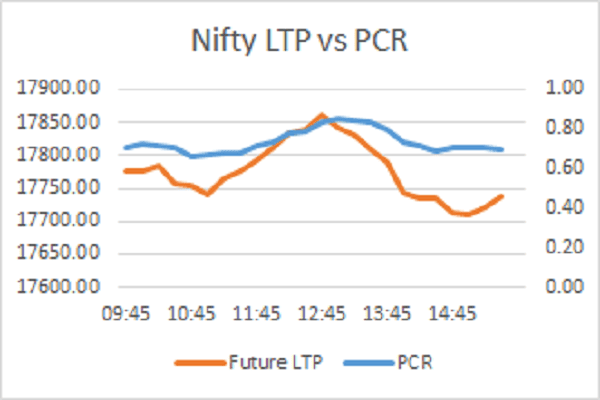
Using the Trend of Nifty Put Call Ratio
Over time, the market trend of PCR is a better way to tell if something is going to happen. Look at the PCR of people who haven’t signed up yet, too.
In this example, let’s say there are 90,00,000 contracts of puts at the Nifty 17,700 strike and 125,00,000 contracts of calls at the same strike and expiration. Then, in that case, there is a PCR (OI) of 0.72.
Again, the trend of PCR (OI) movement is more important than the exact number. One can also figure out the PCR based on how much OI has changed to get a clearer picture.
How to use the Put Call Ratio to figure out what to think about the market?
If you look at any report on derivatives from a broker, you will see a lot of attention paid to the PCR. So, what do you think about the Put Call ratio in real terms?
PCR is one of the most important things you need to know. Traders generally use PCR as a sign that someone is going against the crowd. That means the conclusions aren’t what you’d expect. Then, let’s go into greater depth about this point. For PCR, there is no “range” or “ideal level.” The trend is more important. Here are a few important things to keep in mind when interpreting PCR results.
As a general rule, times, when people are greedy or afraid, show up in high or low levels of PCR. Contrarians think that PCR usually goes in the wrong direction when the market is overbought or oversold, and that is a big factor in how they trade.
A Practical Example
Let’s say that the PCR (OI) has gone up a lot in the last few days, and the market index has also dropped 10% in the last month. How do we see this situation? According to contrarians, small and retail investors are just buying too many puts to protect them from losing money when the stock market goes down. In any F&O market, the put writing is usually done by savvy traders and big businesses that know how to trade. High PCR means that small and medium investors are going to buy a lot of puts, but it also means that more savvy traders are going to sell a lot of puts. Savvy traders usually only sell when they think there is very little they can lose. That could be a sign that the market has hit a bottom.
The opposite happens when the PCR is going down and the market is going up. Those who are small and medium-sized investors are buying a lot of calls, but it also means that more savvy investors aren’t buying as many calls. That is a sign that the market may be at its peak.
How to Combine Nifty Put Call Ratio with Implied Volatility (IV)?
When you combine PCR with Implied volatility, it makes sense (IV) A good way to think about PCR is to think about it with IV. Remember that IV is the volatility that is implied in the price of an option. It shows how people think about risk in the market. Here are a few tips.
- If the PCR rises with an increase in IV, it means that the put activity is rising with a greater sense of risk. That is a bad sign.
- If the PCR rises with a drop in IV, it means that put activity is rising with a lessened sense of risk. The more people write puts, the better.
- If the PCR goes down with a drop in IV, it means that Puts are being unwound and can be seen as a sign that the market may be at a low point.
- In this case, when the IV increases, the PCR goes down. This means that puts are being covered and the market will fall again when the covering is done.
Conclusion
We discussed the Put Call Ratio (PCR) and how it can be used to trade NSE Option Chain data with an 85%-90% success rate. PCR is the ratio of the puts to the calls, and it is used to determine the number of people willing to buy a stock. There are two types of PCR – PCR (OI) and PCR (Volume). We also explained how PCR works, how to calculate PCR from NSE Option Chain, and how to trade using Nifty Put Call Ratio. The PCR trend is a better way to tell if something is going to happen, and PCR can be used as a sign that someone is going against the crowd. We conclude with the fact that the trend of PCR movement is more important than the exact number.


Hi Sir, One doubt if PCR is >= 1.3 we can use the nifty dips to buy right?? Please reply
Yes thats correct, but to be sure try buying at PCR > 1.7. You will get fewer trades in this but sure shot trades.
Yes sir i am observed in bank nifty i am getting PCR 1.90 so it is blasting. But in Nifty it is coming close like 1.25 so we can use this strategy right??
Naresh, BN 1.90 effect is clear now.
Hi sir, For stock derivatives also this same level applicable 1.30 and 0.65??
Yes Naresh, more or less the same levels act as overbought OR oversold zones in all scrips.
sir one doubt this OI is based on nifty futures or nifty spot price. For example if 10200 pe is having more OI we have to check nifty spot price or future price for support?? please explain
what does PCR for individual strike prices reflect and how we can come to conculsions based on that for trading purpose?
PCR is not calculated for a particular strike price. Rather, PCR is for a scrip. PCR levels for a scrip decides whether it is overbought or oversold.
For example (all are dummy figures):- Suppose Nifty PCR is @ 1.3..and now suppose spot price of Nifty is around 10300. And suppose @ 10200 strike price, put open interest is higher than call open interest, then will 10200 act as support price and should we buy @ 10300 or wait for correction towards 10200 and take long position?
Basically I want to ask if @ particular strike price Put OI is greater than Call OI will it act as support & when Call OI greater than Put OI will it act as resistance?
Ajit it’s a good question. PCR is an indication of the market being overbought or oversold. Three options, buy at the current market price or wait for a dip. If you wait for a dip chance is there that you can miss the move sometimes. The third option is to use some trend following indicator like SuperTrend indicator on the hourly chart to give you a buy signal.
Okay sir, another query, what is the criteria for stop loss and when to take an exit within this strategy?
is it intraday or positional trick?
This is for positional of course.
For calculating PCR, you are using Volume data which is less used. Can you please confirm which one to use OI or Volume?
In fact the most authentic definition tells to use the volume of the calls and puts.
Sir, Thanks for guiding the options traders who are unaware of the secrets of the game. Your articles can not be valued in monetary terms as a persons earnings,who learnt the secrets, are unlimited.
You are welcome Saravanan 🙂
SIR if PCR volume is 0.65 and PCR OI is 1.30 than what will be probability of upside or downside way
Raman, it denotes a upside strong market. When the PCR volume will cross 1 look for a sign of weakness.
Sir meand if it cross 1.20 means we can buy calls and if it goes below 0.65 we can buy puts right?
It’s not so easy, have an eye on the market movement too.
sir
from which site will get live put call ratio charts
You can get market hour data plot in our open interest page.