All About Center of Gravity Indicator (COG)

Center of Gravity Indicator

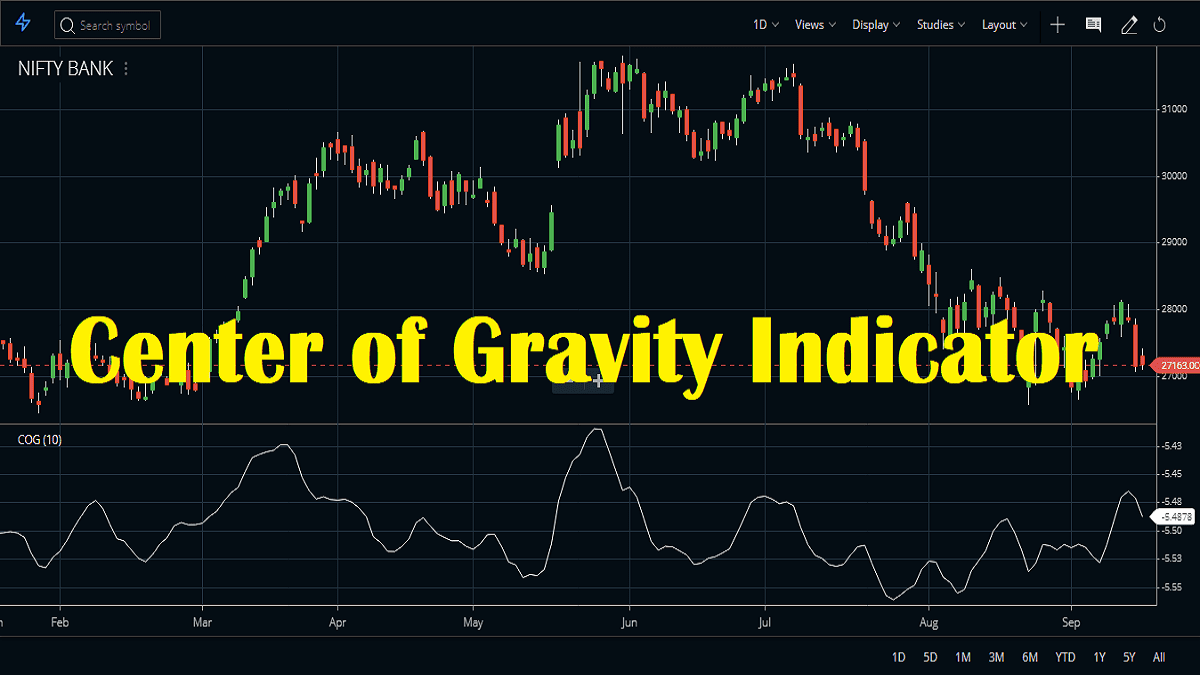
The Center of Gravity indicator or also known as COG is actually an oscillator with almost zero lag. John F Ehlers introduced this COG indicator in 2002. It is a modern oscillator. The COG indicator is an oscillator that is smoothed to prevent undesirable whipsaws. We can characterize the center of Gravity by the following … Read more

Bollinger Bandwidth Technical Indicator, Strategy

We have already learned about the usage of the mother indicator Bollinger Bands. In this post, we will discuss Bollinger Bandwidth (BBW), which is aΒ technicalΒ analysis indicator derived from the standard Bollinger bands. BBW measures the percentage difference between upper and lower bands. Features of the Bollinger Bandwidth Indicator The BBW uses all standard features of … Read more

Bollinger Percent B Indicator (Bollinger %B)

Bollinger %B Indicator

If you are already trading with the Bollinger Bands indicator you will find that the Bollinger Percent B indicator is just the same. The only difference is that the Bollinger %B Indicator gives you a precise number by which you can identify the relationship between the price and the bands. What is the Bollinger %B … Read more

How to Trade the Balance of Power Indicator?

Balance of Power Indicator

The Balance Of Power indicator or BOP measures the power that the buyers and sellers have. It’s a very volatile indicator. It goes up and down very often. It also determines market strength by assessingΒ the strength of total buyers against that of total sellers and their ability to drive the price to extreme ends. More … Read more

Awesome Oscillator Indicator: The Ultimate Guide

Awesome Oscillator

Awesome Oscillator indicator (AO), is an oscillator that helps traders to understand the market momentum. This can calculate the momentum in any time frame. This indicator has been designed by Bill Williams of the Profitunity Trading Group. Now, why is the indicator called awesome? What is so special about it? Awesome Oscillator Indicator FAQ How … Read more

Average True Range (ATR) Indicator: Formula, Settings & Strategy

Average True Range (ATR) indicator rising during volatility expansion on a candlestick chart

Introduction If you have been trading stocks, indices like Nifty or Bank Nifty, or even commodities, you will often notice that sometimes the market moves very slowly and sometimes it becomes extremely volatile. Understanding this volatility is extremely important for traders because volatility determines how far the price can move within a certain period. One … Read more

Aroon Oscillator Formula and Trading Strategy

Aroon Oscillator

Aroon oscillator (ARO) was also developed by Tushar Chande. It actually an oscillator version of the same named Aroon indicator. The name is taken from Sanskrit. In Sanskrit, the Aroon means morning dawn. Like the indicator, the oscillator too identifies a trend and determines how strong the trend is. It also identifies a probable trend … Read more

Aroon Indicator Formula, Strategy, Best Setting

Aroon Indicator

The Aroon indicator was developed by Tushar Chande to determine the price trend of a stock and also to understand how strong is the trend of the stock price. There are two lines in the indicator. The green line shows an uptrend and the red line shows a downtrend. The green line is known as … Read more

Alligator Indicator Trading Strategy, Formula, PDF

Alligator-Indicator

Alligator indicator trading strategy is used by traders to gauge the long and short-term trends of the market/ stock over a specific period of time. This indicator identifies the trend change by using its three constituent components. In this post, I shall discuss the formula or calculation, and trading strategy using this indicator. I will … Read more

Trading the Accumulative Swing Index Indicator

Accumulative Swing Index

Accumulative Swing Index indicator or also known as ASI is used by traders to gauge the long and short-term trends of the price of a stock over a specific period of time. The ASI indicator tends to project real market conditions, the indicatorΒ resembles the true price helping the trader to understand the real market scenario. … Read more

🟣 Zerodha Best Overall 🟒 FYERS Best Charts πŸ”΅ Upstox Beginner Friendly