How to Trade the Disparity Index Indicator?

Disparity Index

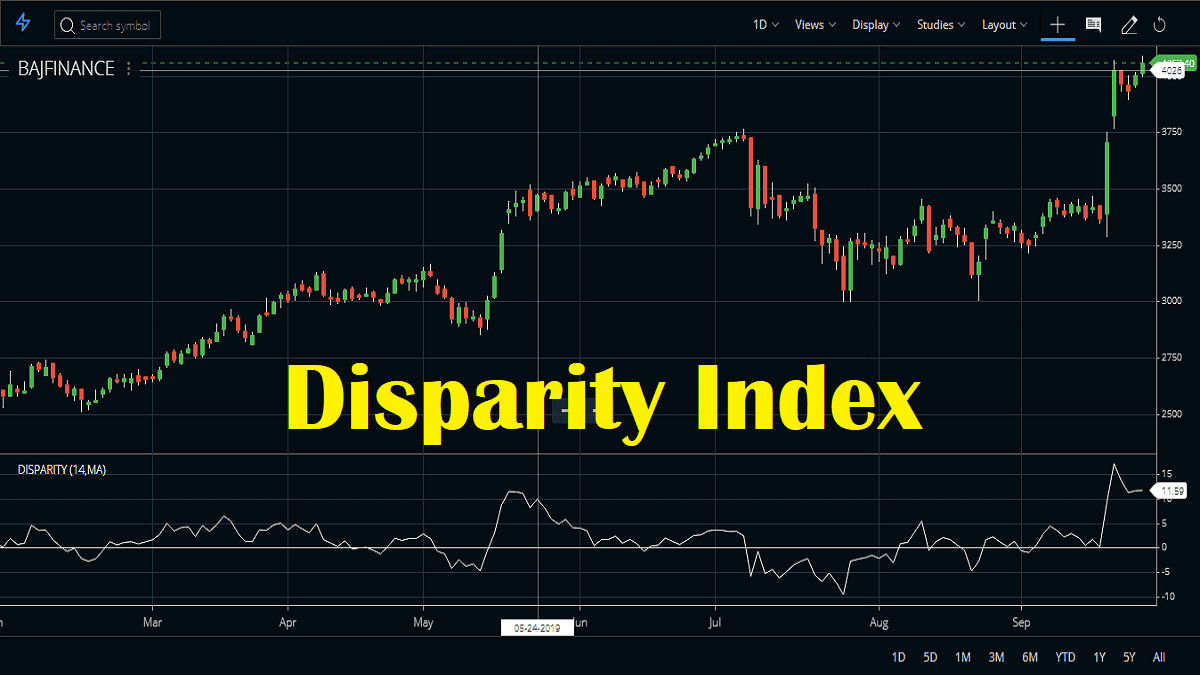
The Disparity Index indicator is a technical momentum indicator that compares the current market price with the moving average of price over a particular time period. This is calculated for a specific time period. Thus, we can easily identify the current price trend with respect to the moving average of a longer time period. ย Steve … Read more

Detrended Price Oscillator (DPO) Usage Guide

Detrended Price Oscillator

As the name implies, the Detrended Price Oscillator (DPO) attempts to eliminate the trends in price through the plotting chart. DPO is based on the fundamental idea that long-term price cycles are made up of short-term cycles. Identifying these short-term components of long-term cycles will be able to help us in finding the major turning … Read more

Darvas Box Indicator and Formula, Strategy

Darvas Box Indicator

Darvas Box indicator is a great technical analysis tool that was introduced by Nicholas Darvas in the 1950s. He was a dancer who made $2,000,000 within a period of 18 months, trading in the market while on a global dance tour using this theory. He has actually this amount of money from just $36000. This … Read more

Correlation Coefficient Indicator Formula, Example

Statistically speaking, we say two sets of data or two variables as correlated if there exists a statistical relationship (linear interdependence) between them. If two data sets or variables have a strong statistical relationship between them, we identify them as highly correlated. The Correlation Coefficient summarizes these two data sets into a single number between +1 … Read more

Coppock Curve Indicator: Calculation & Strategy

The Coppock Curve indicator was introduced by E.S. Coppock in 1965. He designed the indicator to help longtime investors in the market. Primarily he used the indicator for a monthly timescale and used it to create buy opportunities. This is actually an oscillator, that oscillates above or below a zero line. How to Read Coppock … Read more

Commodity Channel Index: CCI Indicator Strategy

Commodity Channel Index

The Commodity Channel Index indicator (CCI) was introduced by Donal Lambert. CCI measures the variationsย in the price of a stock with respect to its statistical mean. Contrary to the meaning derived from its name, the CCI works well with any stock or index. High values of CCI show that the stock price is high compared … Read more

Choppiness Index Indicator Trading Strategies

Choppiness Index Indicator

The Choppiness Index Indicator (CHOP), as the name suggests, was introduced to determine whether the market is choppy. That means it shows whether the market is range bound or whether the market is trending. It also shows the market is following a particular trend in either direction. What is the Choppiness Index indicator? Bill Dreiss, … Read more

Chande Momentum Oscillator Formula, Strategy

Chande momentum oscillator

Chandeย Momentum Oscillator (CMO) was introduced by Tushar Chande who also invented the forecast version of the oscillator. He has created the oscillator by calculating the difference between the sum of all recent gains and that of all recent losses over a particular period of time. Then he divided the result by the sum of all … Read more

Chande Forecast Oscillator Formula, Strategy

Chande forecast osccillator

Chandeย Forecast Oscillator (CFO) was developed by Tushar Chande. This oscillator can be said to be an extension of linear regression-based indicators. This oscillator plots the difference between the closing price of the stock and the linear regression-based price forecast over a specific period of time. We can attach this indicator very easily to the Zerodha … Read more

Chaikin Volatility Indicator Formula and Strategy

Chaikin Volatility Index

Chaikin Volatility Indicator or CVI was developed by Marc Chaikin. He also has developed the Chaikin Money Flow or CMF indicator. Volatility is depicted by the indicator because it calculates the difference between the high and low for every period or candle. Some Common FAQ Chaikin Volatility Indicator Formula This indicator is a volatility indicator … Read more

How to Use Chaikin Money Flow or CMF Indicator?

Chaikin money flow

Chaikin Money Flow (CMF indicator) is an indicator of technical analysis that is used to measure the volume of Money Flow over a specific period of time. This actually tracks the mone flow volume made by institutions. Money Flow Volume, a concept created by Marc Chaikin who also introduced the accumulation distribution line, quantifies the buying and selling … Read more

๐ŸŸฃ Zerodha Best Overall ๐ŸŸข FYERS Best Charts ๐Ÿ”ต Upstox Beginner Friendly