Today we are going to discuss one of the most common and active chart formations. Along with the fundamental analysis, in-depth technical research is also required to predict price movements and market scenarios. Double top stock chart pattern indicates a reverse trend which appears at the end of the trend. Therefore, it is a bearish reversal chart pattern.
What is a Double Top Stock Chart Pattern?
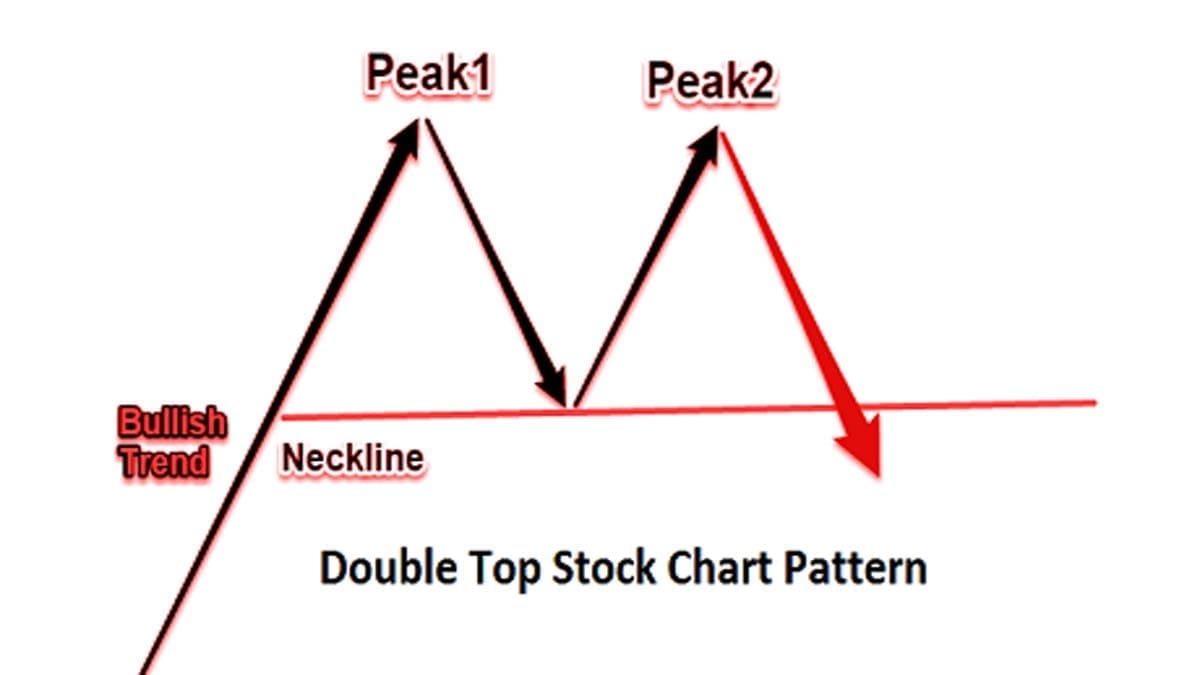
The double-top stock chart pattern comes after a prolonged bullish trend. After reaching a peak point, there will be a sudden decrease in price level up to a certain amount. This is the first peak formation of the double-top stock chart pattern. The second peak forms right after the short downtrend and after that, there will be a breakdown of the price level. This formation creates an “M” like chart pattern which is known as the double top.
Features of the Double Top Pattern
To clarify the pattern, here are some of the features. After mentioning these points, we’ll walk through an example.
- The pattern begins to establish after a prolonged uptrend.
- After the first peak point, the market pulls back up to 20% to 20% and creates a neckline.
- There will be another peak point after the short pullback.
- The difference between the two tops is near about 3% to 4%, not more than that. However, this can be higher in higher time frame charts.
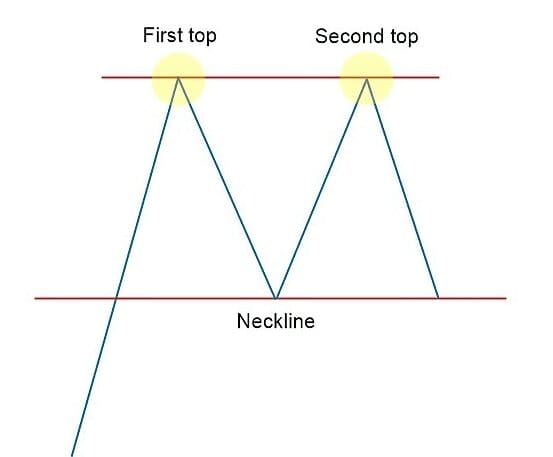
- Two peak points separated by a minimum price level refers to a valley.
- Even after the second peak point, the double top is still not complete. When the price line is broken after the second peak, complete double top forms.
- The price is going to form a bearish trend, taking a long time.
- It is not just an overnight formation.
Example of a Double Top Stock Chart Pattern
As I have stated above that we’ll go through an example here. I’m going to put a recent scenario of Manappuram Finance.


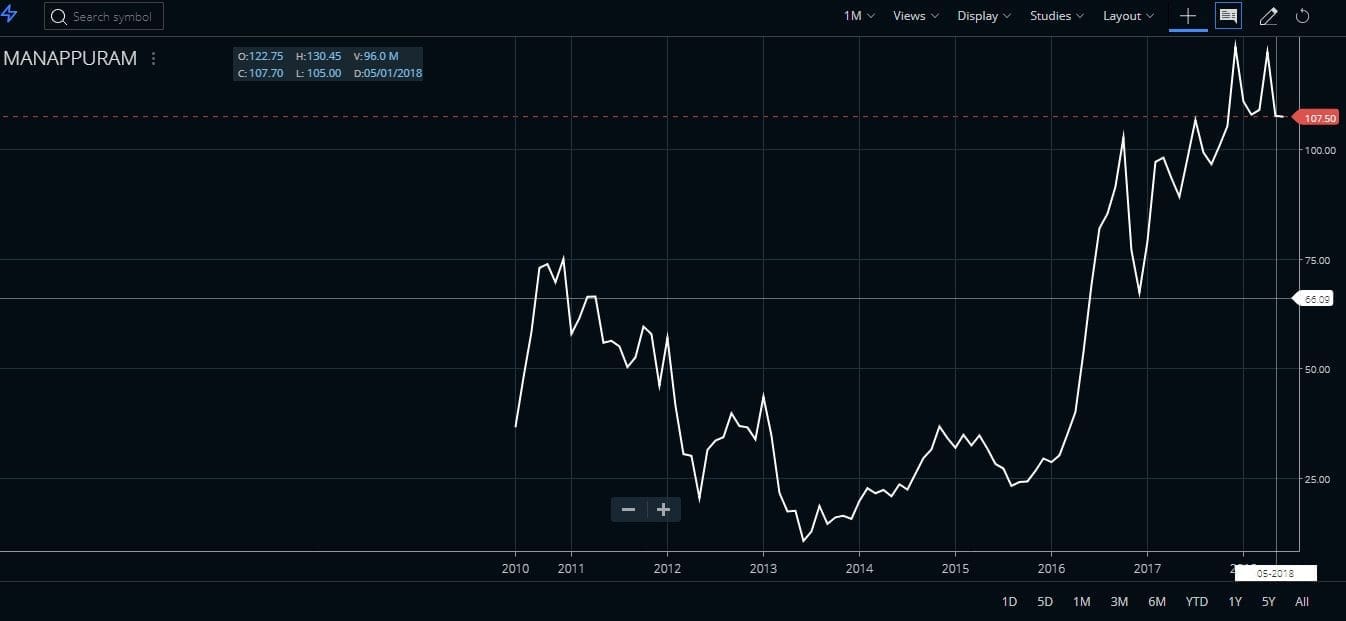
This is a monthly chart of Manappuram Finance (LTP 104.90). The chart is taken from Zerodha Kite. Let’s focus on the above chart pattern.
The prolonged uptrend had started to form a long time back. As we can see here that the price breaks the neckline and completes the double top pattern. When the price breaks the valley between two peaks, the ‘M’ shape generates. The break-line is near about at Rs. 107 which indicates there is a high possibility of a downtrend in the next few months. After breaking the price level at Rs.100, the next possible support will be at Rs. 85 which is 20% low and after that, Rs. 65 will be the expected support line. We advise you to enter the trade with a stop loss of 110-112 and a target of 88.
Reason Behind this Pattern Formation
One of the main reasons behind the pattern can be due to an overbought stock. Many of the investors believed that the management of the company might grow, and expected a hike in the price level, that’s why they held the stocks for years. Hence, the stock has rallied a lot and finally, the over-bought situation arises. Now, in this present scenario, they try to sell the stocks to book their profits. As a result of this profit booking, the double-top stock chart pattern emerges.
However, the pattern indicates a bearish market trend. In order to identify the pattern completely, traders have to wait for the breakdown of the neckline completely. The pattern now advises us to sell Manappuram at the current market price in the futures market. Hold till the target is achieved and carry forward future contracts as and when necessary.
FAQ
Double Top charting pattern is a bearish reversal formation, which can be seen in stock price movements. It occurs when the price of a security moves up to a certain point and then drops back down before rising again to the same level or near-same level as before. This indicates that there is not enough support for higher prices and signals lower prices in the future.
Generally no, because it suggests that potential buyers have become exhausted after two attempts at pushing prices higher, unable to overcome selling pressure from traders who sold earlier. Therefore, this usually signals market resistance and points towards an upcoming sell signal.
Short-term traders often look for double tops since they are more reliable and appear quickly on the charts; typically within a 1–4 weeks timeframe depending on the security’s volatility. Long-term investors may also notice these patterns over 3–6 months but need to pay (close) attention as they tend to occur less frequently than with short-term trading strategies.
After spotting such kind of setup in Indian stock markets, one should wait until the bottom line/support dips below the ‘neckline’ – which marks the start of a downtrend with a target placed approximately equal distance below the breakout point of the neckline & swing low between two peaks or we can say midpoint between 2nd peak and neckline break out point; Unless momentum reverses before reaching the Bearish target set post-Neckline breach!
Conclusion
The double-top stock chart pattern is one of the most reliable and easy-to-spot chart patterns a trader can use. The pattern itself comprises two sequential peaks in prices, followed by a lower low which could potentially signal a bearish cycle for the stock. Traders should keep an eye out for this scenario when it occurs as it may offer opportunities for short selling or even smaller profits from scalping practices. Furthermore, taking into consideration other related technical indicators before entering any position would be essential so that traders maintain control over their risk/reward ratio and position size accordingly. Overall, with its reliability in detecting potential market topsides, the double top should definitely be part of any trader’s trading arsenal.


