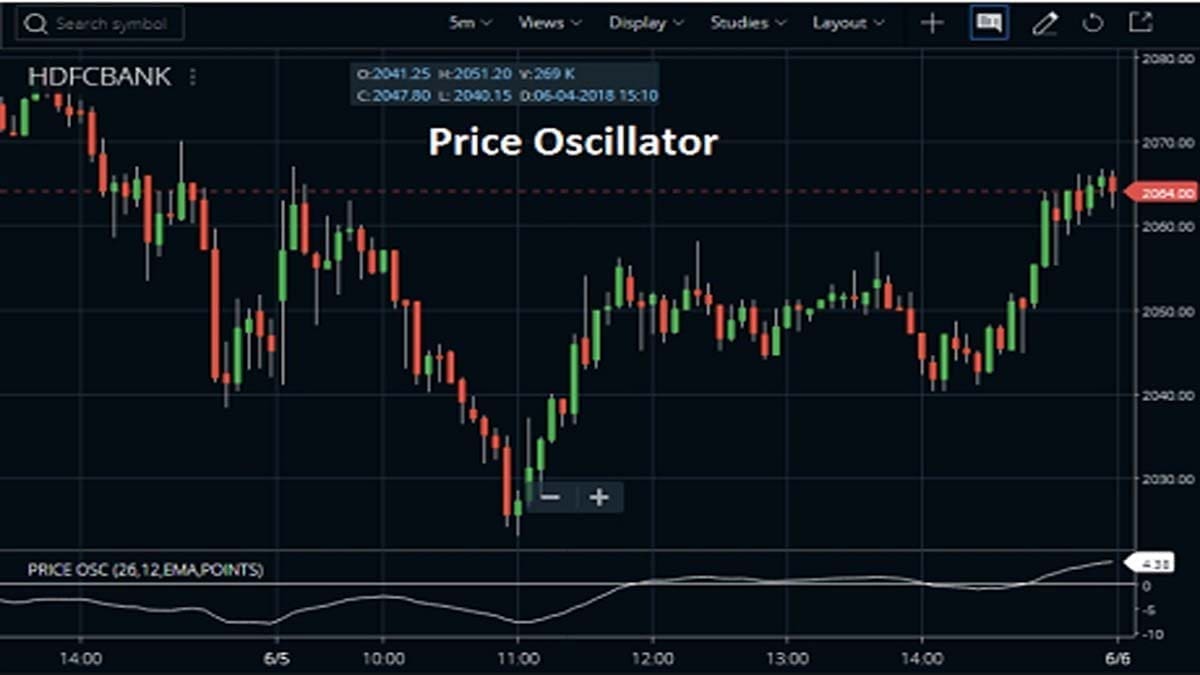
The Price Oscillator Indicator, also known as the Percentage Price Oscillator (PPO) is a technical analysis tool, used for measuring momentum. This indicator mainly suggests the overbought and oversold areas, confirming bullish, bearish price moves. This article contains its calculation method and trading tactics.
What is Price Oscillator or Percentage Price Oscillator?
The Price Oscillator shows the relationship between two moving averages in percentage terms. That’s why it is often termed the Percentage Price Oscillator. Generally, traders use this PPO or Percentage Price Oscillator to compare asset performance, volatility, divergence, trading signals, and lots more.
Features of the PPO
- The PPO or Percentage Price Oscillator contains 2 lines, the PPO line, and the signal line.
- The signal line is an EMA of the PPO. Hence, it moves slower than the PPO.
- Sometimes, traders prefer the PPO because readings are comparable between assets with various prices, whereas MACD readings are not comparable.
What is the Relationship Between the Price Oscillator and MACD?
The PPO is almost identical to the moving average convergence divergence or MACD technical indicator. They both are momentum oscillators, measuring the difference between the two moving averages. But still, there are differences between the two, as stated below:
PPO vs MACD
- Here, PPO measures the percentage difference between the two EMAs, while the MACD measures the absolute (dollar) difference.
- MACD(12,26,9) computed the absolute difference between the 12-day and 26-day exponential moving averages (EMA). On the opposite side, PPO(12,26,9) takes MACD one step further by showing the percentage difference between these two MA.
How to Calculate Percentage Price Oscillator Indicator?
The Percentage Price Oscillator line is the result of a long-term EMA and subtracting it from a shorter-term EMA. Then the result is divided by the longer-term EMA and then multiplied by 100. Traders mainly use values 26 days EMA (for the longer-term EMA) and 12 days EMA (for the shorter-term EMA) for this PPO line.


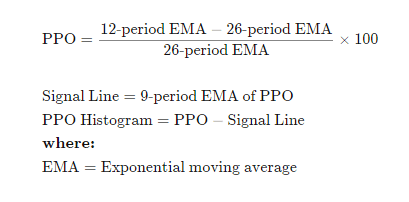
The Detailed Explanations of the PPO Formula
- First, calculate the 12-period EMA of the asset’s price.
- Then, calculate the 26-period EMA of the asset’s price.
- After that, apply these to the PPO formula to get the current PPO value.
- Now, once there are at least nine PPO values, originate the signal line by calculating the nine-period EMA of the PPO.
- To formulate a histogram reading, subtract the current PPO value from the current signal line value. So, the histogram is an optional visual representation of the distance between these two lines.
How to Set up the Price Oscillator on Your Charts?
To set up the PPO indicator, you need to open the terminal first. Here, I’ve taken Zerodha Kite and Upstox Pro to set the examples.
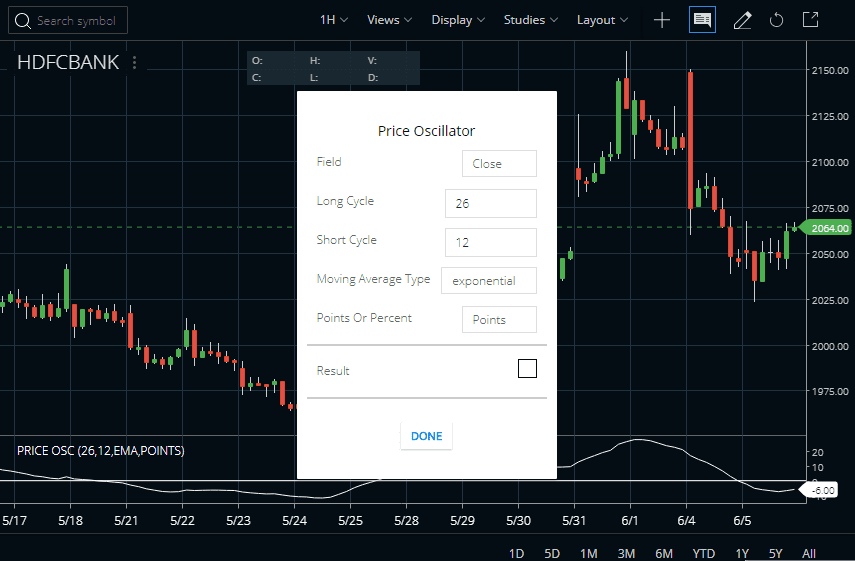
PPO Indicator on Zerodha Kite
To attach the Percentage Price Oscillator (PPO) indicator, traders can find it under the STUDIES section in the Zerodha Kite browser app and it is also available in the Kite mobile App. The Field is close or you can also choose from OHLC.
We can also set the field Short Cycle at 12 and we can these values to high or low. The Moving Average Type is simple/exponential etc and we also change this. Please check the image below to understand how we attached the PPO indicator to the HDFC Bank share price chart. You can attach the PPO indicator to any chart like daily, weekly, monthly, or intraday.
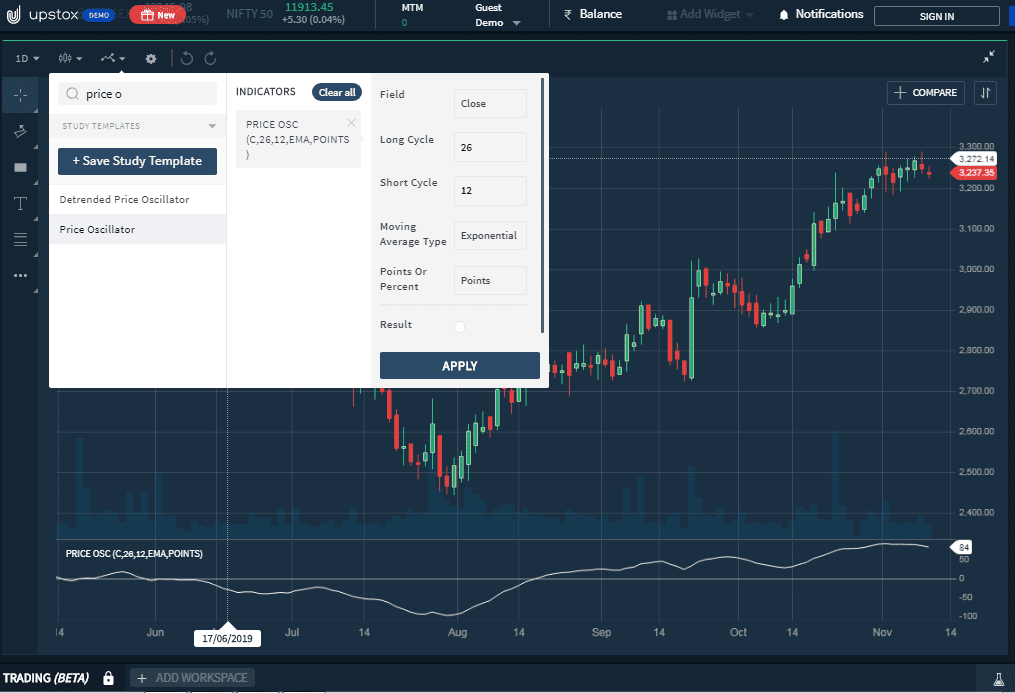
PPO Indicator on Upstox Pro
The setup process in Upstox Pro is almost similar to Zerodha Kite. You need to log in to your account first, then open the chart and indicator section. There put down the indicator name and click on the Apply option.
Trading Tactics of the Price Oscillator Indicator
Cross of the PPO Indicator and the Zero Line
- When the PPO is above zero that helps indicate an uptrend, as the short-term EMA is above the longer-term EMA.
- When the PPO is below zero, the short-term average is below the longer-term average, which helps indicate a downtrend.
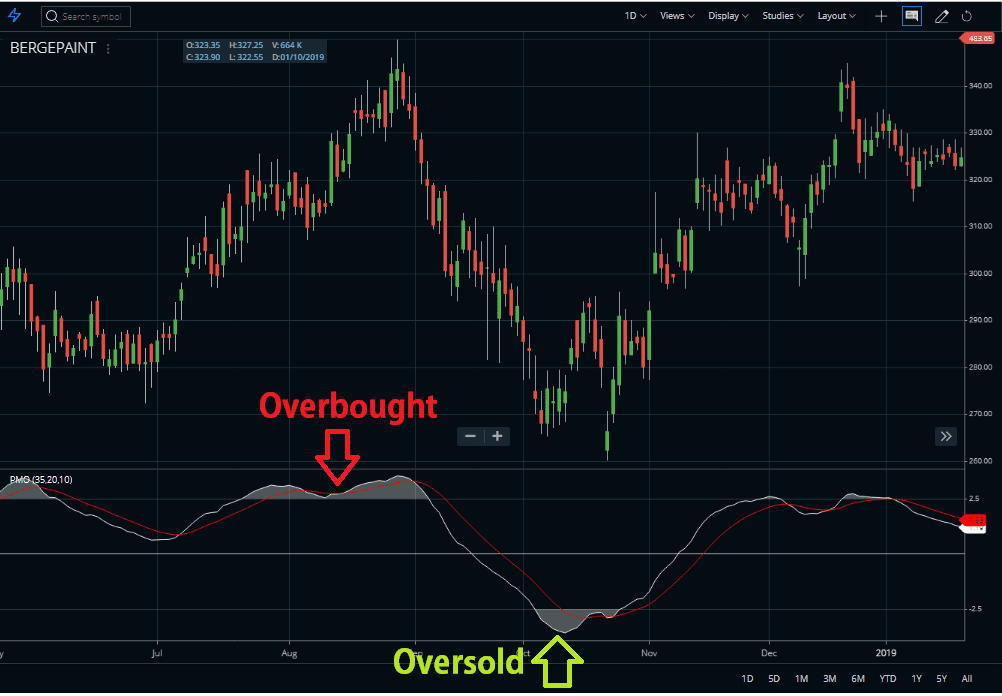
Trading the Overbought and Oversold Levels in the PPO Indicator
- Here, one more thing traders should consider is that if the price goes at or above 2.5, it is overbought. Oppositely, when the price goes at or below (-2.5), it is oversold.
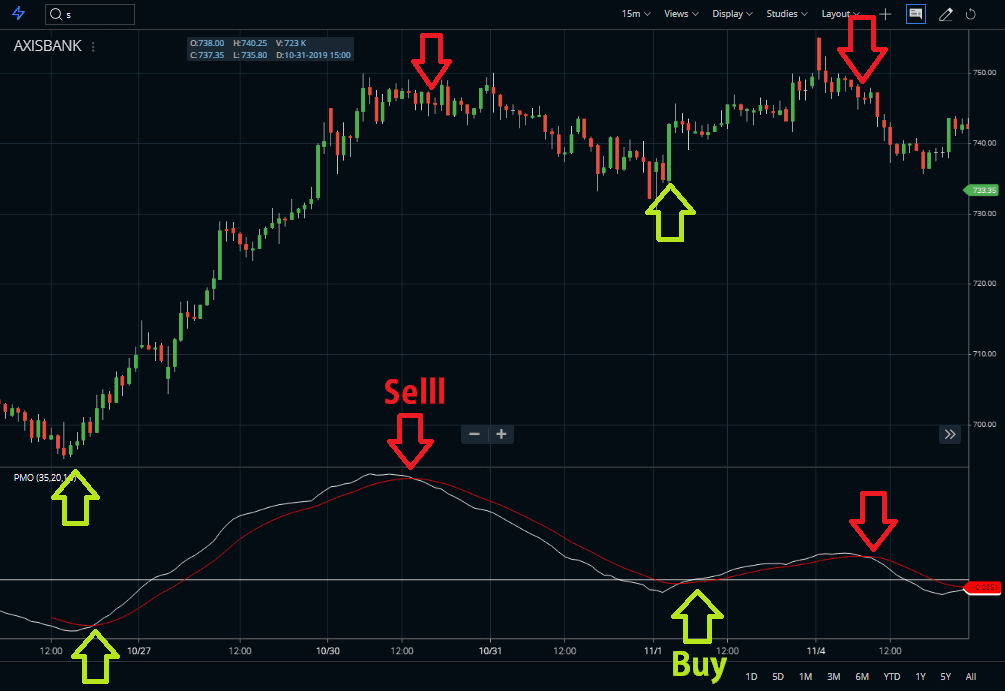
- Traders use the PPO crossing the signal line as a trade signal. Once it crosses above from below, that is a buy, when the prices cross below from above that is a sell.
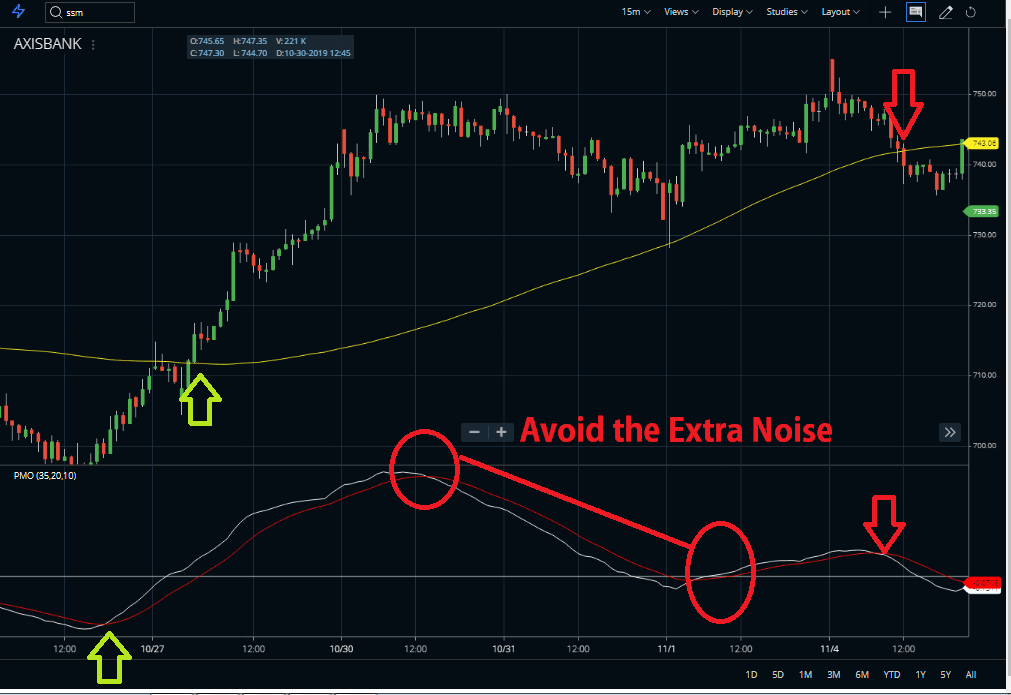
Fine Tuning with a Moving Average
In order to avoid noise, here I add 100 MA (Moving average). Once the price crosses the MA above buy at the crossing point and sells at the down line. In this way, you can easily ignore the extra noise.
FAQ
The Price Performance Oscillator (PPO) has a range between +100 and -100. Generally, readings above 0 suggest Bullishness while those below 0 suggest Bearishness.
Price Moving Oscillator (PMO) also known as Price Movement Index, measures upswings in prices over time by comparing current closing prices with past closing prices. It indicates strong trends in both upward and downward directions when combined with other indicators like RSI or MACD.
An oscillation occurs around its zero line and it’s used to measure cyclical swings up and down for different types of markets such as stock market indices or individual stocks. Commonly used technical analysis tools like Moving Average Convergence Divergence (MACD), Relative Strength Index (RSI), etc are examples of popular signals that were developed from this kind of insights drawn from reading price charts through these types of indicators techniques.
Conclusion :
The Price Oscillator Indicator or PPO generates the same signals as the MACD. It also provides an added dimension as a percentage version of MACD. The PPO levels of the Nifty 50 (price ~10700) can be compared against the PPO levels of Sun Pharma (price ~490) because of the PPO “levels” in the trading field. Also, PPO levels in one security can be compared over extended periods of time, even if the price has doubled or tripled. This is not the case for the MACD. The advantage of this Percentage Price Oscillator Indicator (PPO) is this technical pointer is still not the best oscillator to identify overbought or oversold conditions because movements are unlimited.

")
