
Introduction
Recently, India Infoline published a research report recommending buying TVS Srichakra’s stock. The report analyzed the company’s charts and observed a flag pattern breakout, indicating a good return on investment in the short to medium term. In this post, we will discuss TVS Srichakra, its growth potential, and technical analysis findings.
About TVS Srichakra
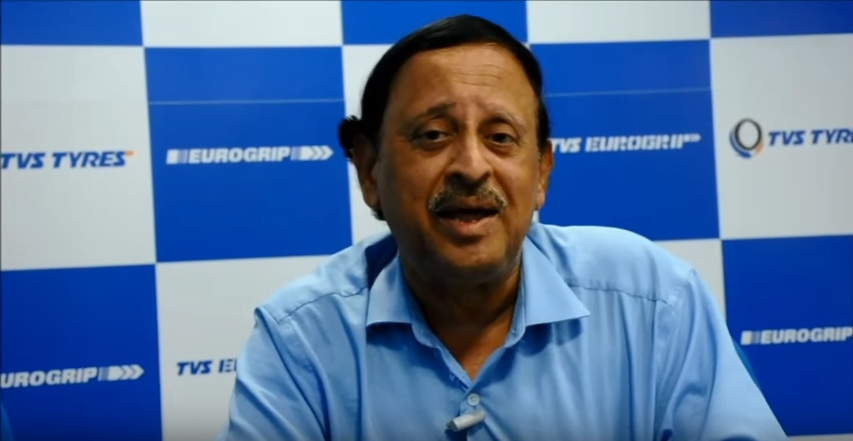
TVS Srichakra is a tire maker and rubber products company based in India. The company is headed by Mr. P. Vijayraghavan and operates under the brand name TVS Tyres. TVS Srichakra has achieved success in after-market exports and new product launches, enabling it to be the largest supplier to vehicle manufacturers.
Growth Potential in the 2-Wheeler Industry
According to Mr. Vijayraghavan, there is good growth potential in the 2-wheeler industry. Despite tough competition from the flooding of Chinese tires, TVS Srichakra continues to be the number one supplier to vehicle manufacturers. The impact of Chinese imports is more on truck and bus tires rather than 2-wheeler tires. This growth potential and competitive advantage in the 2-wheeler industry make TVS Srichakra an attractive investment opportunity.
Flag Pattern Breakout:
A flag pattern breakout is a technical analysis pattern that signals a continuation of an existing trend in the stock market. It is characterized by a brief period of consolidation after a significant price movement, followed by a sudden breakout in the direction of the original trend. The consolidation period usually forms a flag shape, hence the name “flag pattern.”






This pattern is widely used by traders and investors to identify potential buying opportunities in the stock market. A successful flag pattern breakout can result in substantial returns in a short amount of time.
Examples of Flag Pattern Breakout
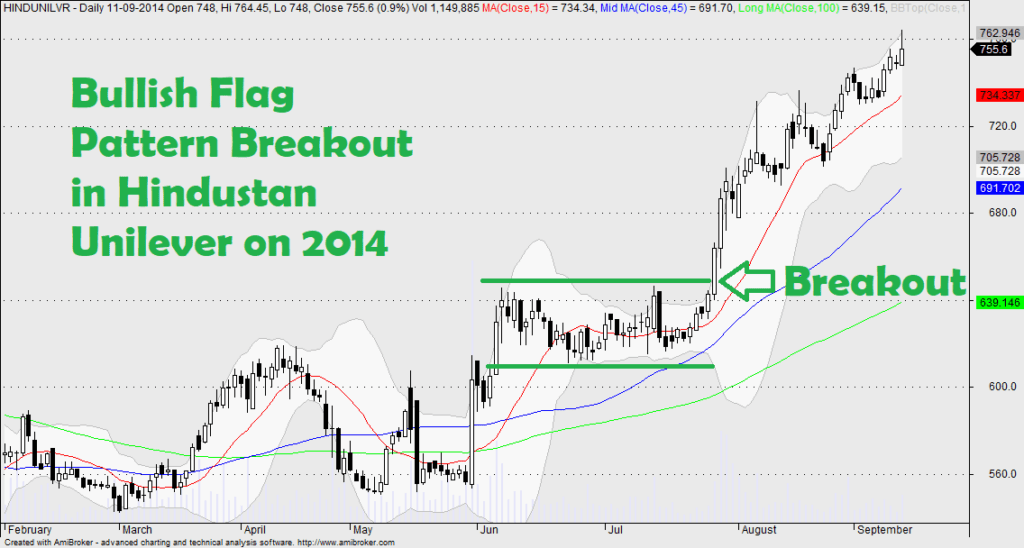
Apart from TVS Srichakra, there have been several other real-life examples of flag pattern breakouts in the Indian stock market. One such example is Hindustan Unilever, which experienced a bullish flag pattern breakout in July 2014. After a significant price movement, the stock consolidated for a few weeks, forming a flag shape. The breakout occurred when the stock price broke through the upper trendline, indicating a continuation of the upward trend. This resulted in substantial returns for investors who bought the stock at the breakout point.
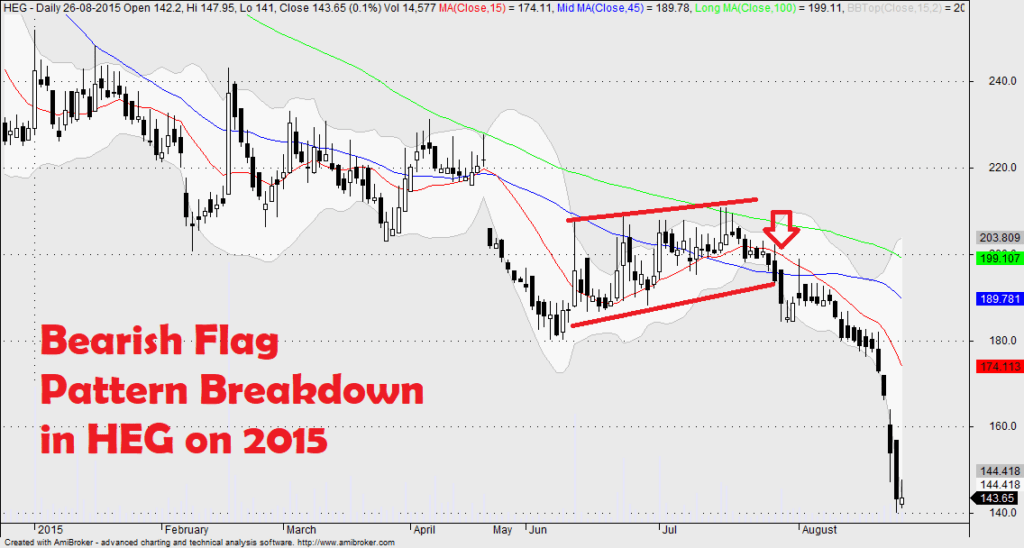
Another example is HEG, which experienced a bearish flag pattern breakdown in July 2015. The stock had been in a significant downtrend for several months, and after a brief consolidation period, the breakdown occurred when the stock price broke below the lower trendline. This signaled a continuation of the downward trend and resulted in significant losses for investors who bought the stock previously.
Technical Analysis of TVS Srichakra
India Infoline’s research report analyzed the company’s weekly charts and observed higher tops and bottoms. The report also observed a breakout of the flag pattern in the weekly chart, indicating a potential upside of 17% from the current valuation. India Infoline recommends buying the stock around 3050-3080 with a protective stop below 2697 for a flag pattern breakout target of 3590.
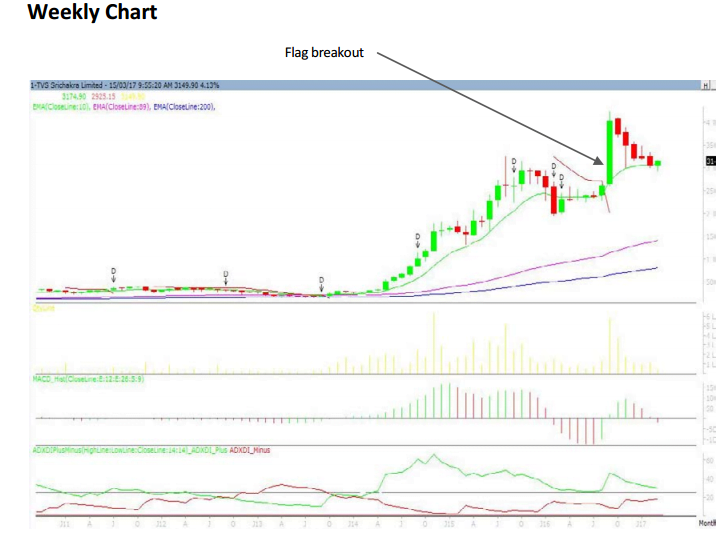
You can download the full research report by clicking here.
FAQs on Flag Pattern Breakout
A flag pattern breakout is a technical analysis term used to describe a bullish continuation pattern in stock charts. It appears as a brief consolidation period or sideways movement in the price of a stock after a sharp increase. The pattern resembles a flag on a flagpole, hence the name.
A flag pattern breakout is typically considered a bullish continuation pattern. This means that it occurs during an uptrend and is a sign that the upward movement is likely to continue after the consolidation period.
Traders can trade flag breakouts by waiting for the stock price to break above the upper trendline of the flag pattern. This is considered a buy signal as it indicates a potential continuation of the upward trend. Traders can place a stop loss order below the lower trendline of the flag pattern to limit potential losses.
A bullish flag breakdown is a rare occurrence and is essentially the opposite of a bullish flag pattern breakout. It occurs when the price of a stock breaks below the lower trendline of the flag pattern during an uptrend. This can signal a potential trend reversal and may be a sell signal for traders.
FAQs on TVS Srichakra
TVS Srichakra is a tire maker and rubber products company. The company operates under the brand name TVS Tyres and focuses on designing two-wheeler tires and developing new products. It also has plants in Madurai and Rudrapur.
Yes, TVS Srichakra is considered a good company in the tire and rubber products industry. It is the largest supplier to vehicle manufacturers and has achieved success in after-market exports and new product launches. Additionally, technical analysis findings indicate a potential upside in the short to medium term.
The salary of TVS Srichakra in Madurai varies depending on the position and experience level of the employee. However, the company is known for offering competitive salaries and benefits to its employees.
TVS Eurogrip is a part of the TVS Group, which is a conglomerate based in India. The company is headed by Mr. Sudarshan Venu, who is the Managing Director of TVS Motor Company, another subsidiary of the TVS Group.
Conclusion
Based on India Infoline’s research report, TVS Srichakra’s stock appears to be a promising investment opportunity. The company’s success in after-market exports, new product launches, and competitive advantage in the 2-wheeler industry make it a strong player in the market. Additionally, the technical analysis findings indicate a potential upside of 17% from the current valuation. As always, it’s important to conduct your own research before investing in any stock.



Thanks for excellent call in TVS Srichakra… expect more such calls
MVS
Well MVS, there will be more like this. Keep following us.