
Hot Tips App is the best stock trading app for beginners and the latest fantastic gift for its subscribers. The CEO, Mr Indrajit Mukherjee has personally looked after the development of this best stock trading app for beginners. This app provides daily updated Techno Funda Scanners at the start of every trading day. The types of scanners are Intraday, End of Day and Index analysis. In addition, there are Algo alerts, Market alerts and Today Hot Stocks. There are the Market Mood Index and Quick Access Points to help the subscribers. It is our assurance that active traders will not have to sit all day for a signal. Traders will be busy.
This post is prepared with the view that traders do not have to look elsewhere to look for help during the market. We will analyse why this is the best stock trading app for beginners. This post attempts to simplify even the smallest aspect mentioned in the app and make things easier.
Hot Tips Home Screen, The Best Stock Trading App For Beginners
As soon as you click on the Hot Tips App icon, the Home Screen comes up. On the Home Screen, there is an unmistakably prominent Dashboard. Below that there is the Market Mood Index which indicates the average mood of the traders.
Below the Market Mood Index, there are Quick Access Points. Quick Access Points has three buttons. They are Profile, My Blogs and Help Centre.
At the top of the screen, in the top left-hand corner, three small parallel horizontal lines are there. Once you click on the lines, the screen will take you to some other buttons arranged one below the other. These buttons are Profile Setting, Terms and Conditions, Privacy Policy, My Blogs and Help Centre.
Below the above buttons, there is a button – Logout Now. It is for those who want to log out of the app.
Dashboard of the Hot Tips App
Whenever you open the app, the Dashboard opens automatically. It covers almost the whole of your mobile screen. The dashboard of the Hot Tips app contains four basic but important buttons.
On the top, there is the Tecno Funda Scanners followed by the View All button within and just below it.
Below we have the Ago Alerts button. Within it but just below, there is the write-up saying You Have New Algo Alerts if there are any.
Below the above button, the app shows the Market Alerts button. Below it we can see You Have New Market Alerts if there is any.
At last, we can see the button named, Today’s Hot Stocks. Just below it, there is View All Hot Stocks.
Now we will see what all these buttons about and understand how to use them methodically to gain maximum advantage.
Tecno Funda Scanners of the Best Stock Trading App for Beginners
Once you click on the Tecno Funda Scanners, you will go to the next page. The new page opens with three new scanners. First comes the Intraday Scanners. The next is the End of Day Scanners. And the last button shows Index Analysis.
Intraday Scanners
Firstly comes the Intraday Scanners. This section is probably the most favoured section for all traders. Every day, millions of traders trade in intraday. Most of these traders prefer a theory of quick in, quick out. It means the trader wants to trade an asset for a very short term, within a day, make a profit and close the trade. These trades may be completed within a very short time, say 5 mins, 15 mins and such. This app has provided the facility to find calls through scanners which were rarely possible for a trader.
Use of the Scanners
Through these Tecno Funda Scanners, traders can get logically provided calls, get into the trade when calls are shown and close the trade at the right time, exit the trade without much emotional attachment. It is a kind of gift, thanks to Mr Indrajit Mukherjee, to the traders which was not earlier easily available to common traders.
The Intraday Scanners has two kinds of scanners. The first one is the Open – High – Low Scanners and just below it is the Opening Range Breakout (ORB). Let us discuss what these scanners mean.
Open – High – Low Scanners
These scanners scan the market for Open – High – Low signals. These scanners are of two types and work well after the market opens.
Open = High Scanners
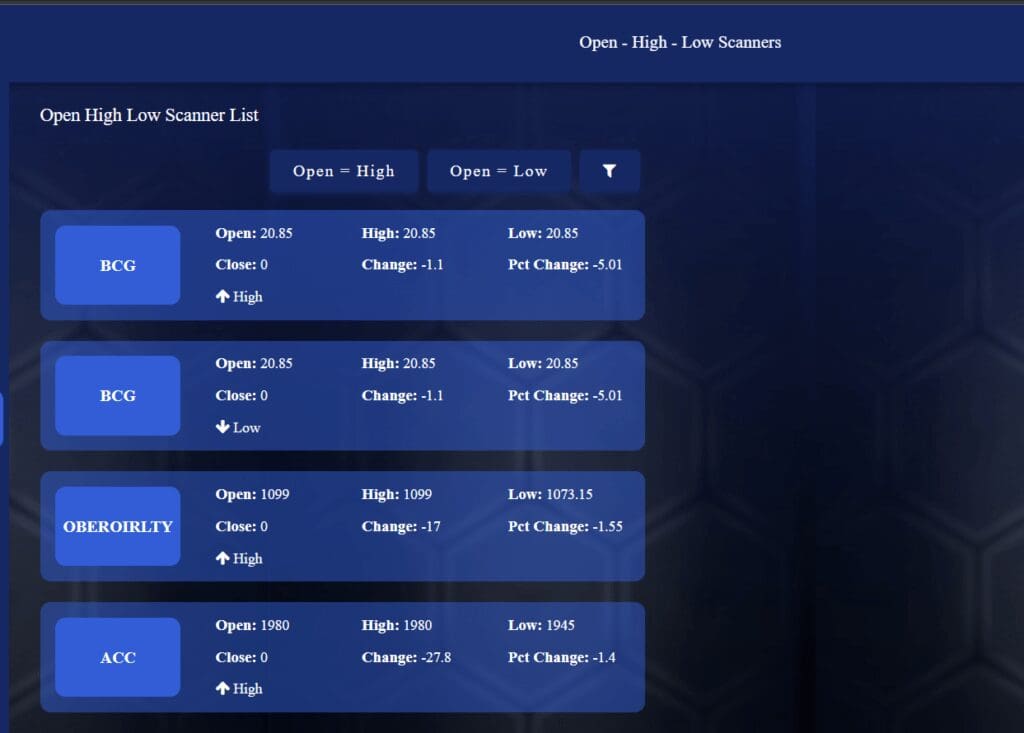
The first among the scanners under this category are the Open = High Scanners. During an existing downtrend, when a stock opens at its highest opening price and then comes down forming red candles, it is a good signal for a short sell. We may find the stock making lower lows all through the day creating a specific downtrend. Moreover, this signal works very well if the market sentiment is negative. These trades may give good profit to an intraday trader. The trade should be taken within the first hour of market opening. The scanner will also give a signal on when to exit.
Filter Signals
By clicking on the Open = High Scanners button we land on another page. There is a Filter signal, just beside the the heading Open – High – Low Scanners. The filter symbol looks like a solid funnel for traders to easily identify it. If you click on the filter signal after selecting any of the Open = High or Open = Low scanners, a new white window opens in the centre of the page. The window shows what kinds of filters are there for a trader.
The Filter button has four subdivisions, namely Nifty 50, Nifty 500, F & O and Bank Nifty. After checking the day’s market sentiment, the trader should select the types of stocks to trade. Otherwise, there is a huge array of stocks available for trading. The Filter is necessary to avoid confusion. Supposing a trader prefers to trade in Nifty stocks for intraday, the trader should select the Nifty 50 checkbox. After selecting the checkbox, a tick symbol will appear showing the selection. The trader should select done button at the bottom, to come out of the Filter window and back to the scanner page and see what is in store.
These scanners give live signals. Therefore, the same signal may not stay and is subject to change depending upon the built-in algorithm of the App.


Filtered Signal of Open = High Scanner of Hot Tips App
After a trader chooses, say Nifty 50 stocks and filters them for intraday signals, a screen appears. From the list of stocks that appeared, the trader picks up a stock and selects them. Say the trader clicks on DRREDDY. Once the trader selects the stock on-screen by clicking over it, a new window appears showing all the tecno funda details of the signal.
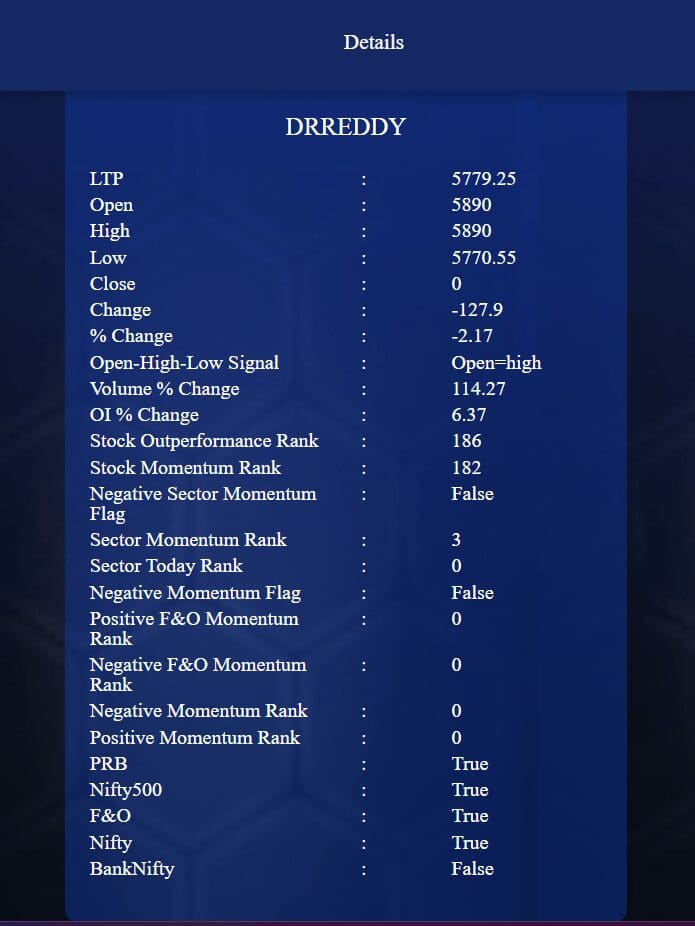
Now if you look at the data, the first thing one may notice is the prices. The stock opened at Rs 5890 and it was the highest price. The stock came down to Rs 5770.55. Currently, the stock is trading at Rs 5779.25. Hence, it was a good call and gave a profit but there was no negative momentum either in cash or in F&O. Thus these automated calls seem good and give traders a chance to make money. However, the trading decision depends on the individual trader’s decision. Similarly, we will find other calls as well.
Open = Low Scanners
Similar to the Open = High Scanners, we can find another scanner. This scanner is the Open = Low scanners. When the market is in an uptrend, if a stock opens with a price that is the lowest price of the day, the stock will go in one direction only. This will be an upside-unidirectional move. A trader can gain immensely from such a signal if the trader buys the stock within the first hour of the day.
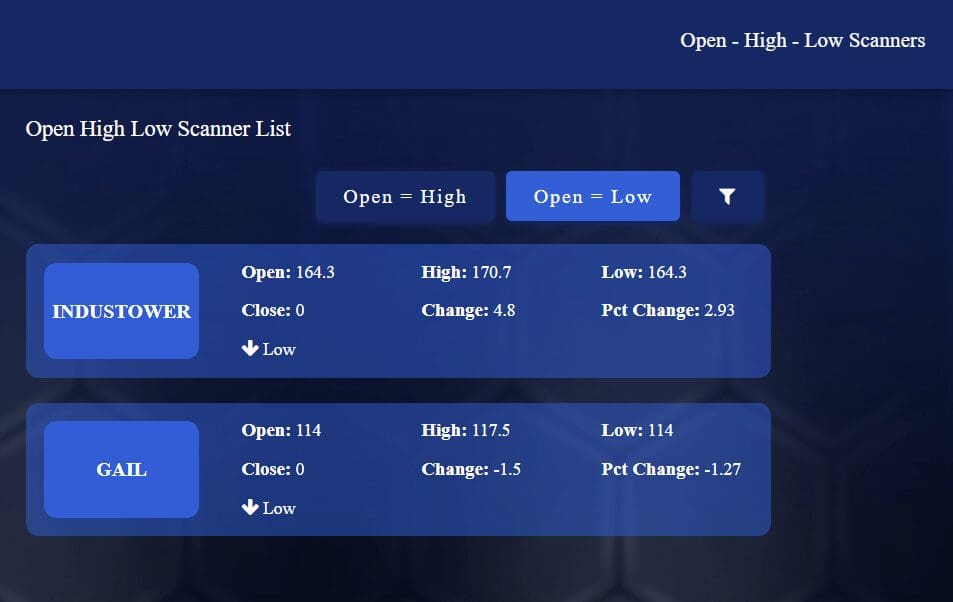
The scanner shows only two stocks. The trading day had negative market sentiment. Consequently, we did not get many stocks on this list. Only two stocks, Gail and IndusTower are there. None of them made much profit because of the negative market sentiment.
We can delve deep into these stocks. Once a stock, say, IndusTower is chosen another window giving all the details, will come.
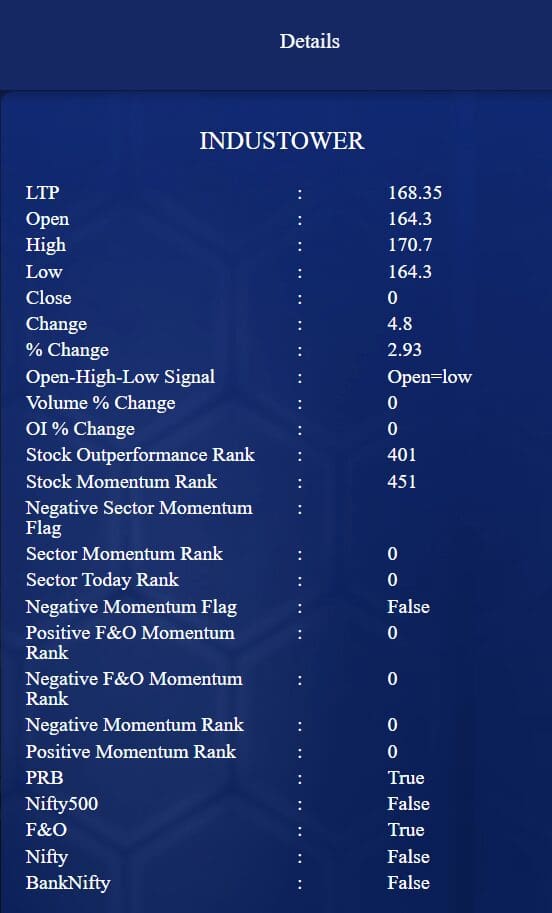
Let us look into the data closely. Both the open and low price was Rs 164.3. The highest price was Rs 170.7. It did not give much profit but a trader can make little profit. It belongs to the Nifty 500 group and is not on the F&O list. There was no momentum as such but still, it gave a total of 2.93% within the day.
Similarly, we can find different intraday signals using the Open-high-low scanners daily. And there will be days when stocks will move with good momentum and give opportunity to traders. Hence even on days, when there is no or little momentum, a stock may give smaller profits. It is a trader’s discretion and mental preparation to go for a particular trade in the stock market.
Opening Range Breakout (ORB)
Opening Range Breakout (ORB) refers to the price range (highs and lows) of a short period after the market opens. This intraday scanner offers a price scan of two periods, 30 minutes and 60 minutes. Hence, a trader checking this intraday scanner should first select the ORB time frame.
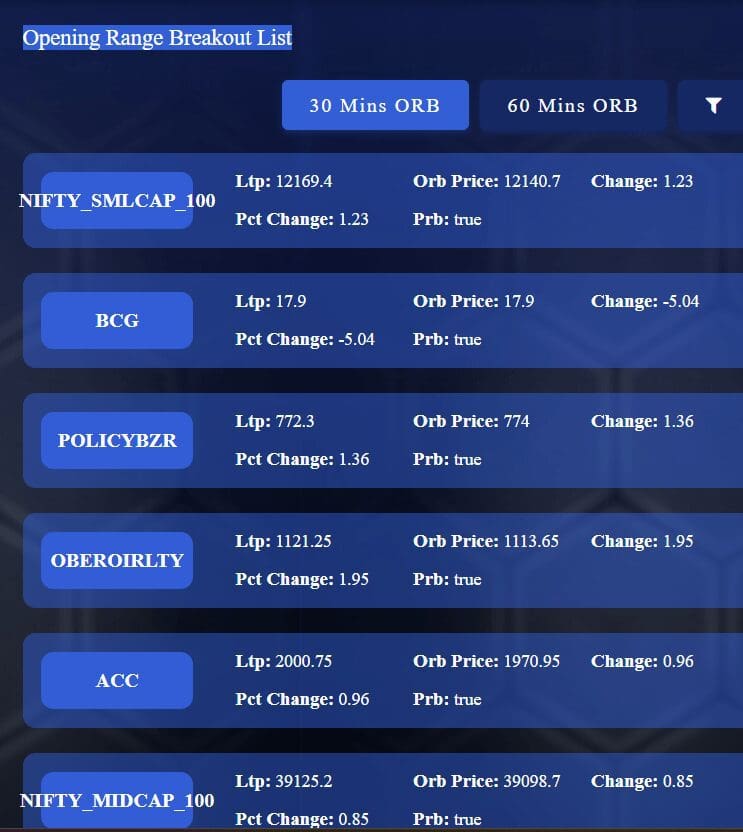
Supposing a trader wants to check the 30-minute ORB scanner. Hence the trader must check it at 09:45 hours on a trading day because the trading starts at 9:15 hours in the morning. If the trader wants to check the 60-minute scanner, the trader should check it after the first hour, after 10:15 hours.
The 30-minute scanner in the image shows the scan result as of 30-08-2023. The ORB scanner scans the stocks’ opening range within the first hour or half-hour. Opening range refers to the high and low of a stock within a specific period. Here it is 30 minutes or 60 minutes.
Opening Range Breakout (ORB) Trading Strategies
Opening Range Breakout when say after the first opening range is established, the stock price goes above the high or below the low of the opening range. If a breakout happens, we may trade along the direction of the breakout. Consequently, traders buy above the opening range or sell below the opening range. It is an established pattern and traders prefer to follow the price pattern.
Our scanner chooses the stocks in which the opening range breakout happens as per the time frame. The scanner arranges the stocks as per movement. You can see in the image, that there is Nifty Smallcap 100 stocks and then Midcap 100 stocks and so on. Smaller stocks may have bigger price movements in them. Therefore, they are at the top.
If you want to know more about ORB strategies, you can check out our blog.
END OF DAY Scanners
Till now we have been discussing the intraday scanners. Now, let us move to End Of Day (EOD) scanners. Many traders prefer EOD trading strategies because the strategies are less risky. Also, traders get ample time for trading.
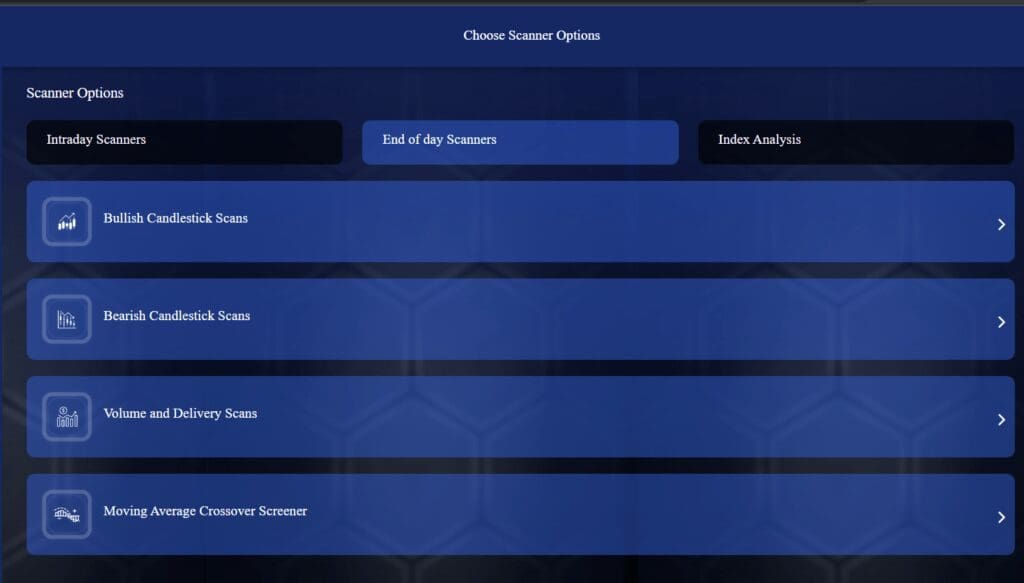
As we can see, the End of Day Scanners comprise different scanning options. There is the Bullish Candlestick Scan, Bearish Candlestick Scan, Volume and Delivery Scan and Moving Average Crossover Scanner.
You can choose any of these scans and go to the next landing stage. The first on the list is Bullish Candlestick Scan.
Bullish Candlestick Scan
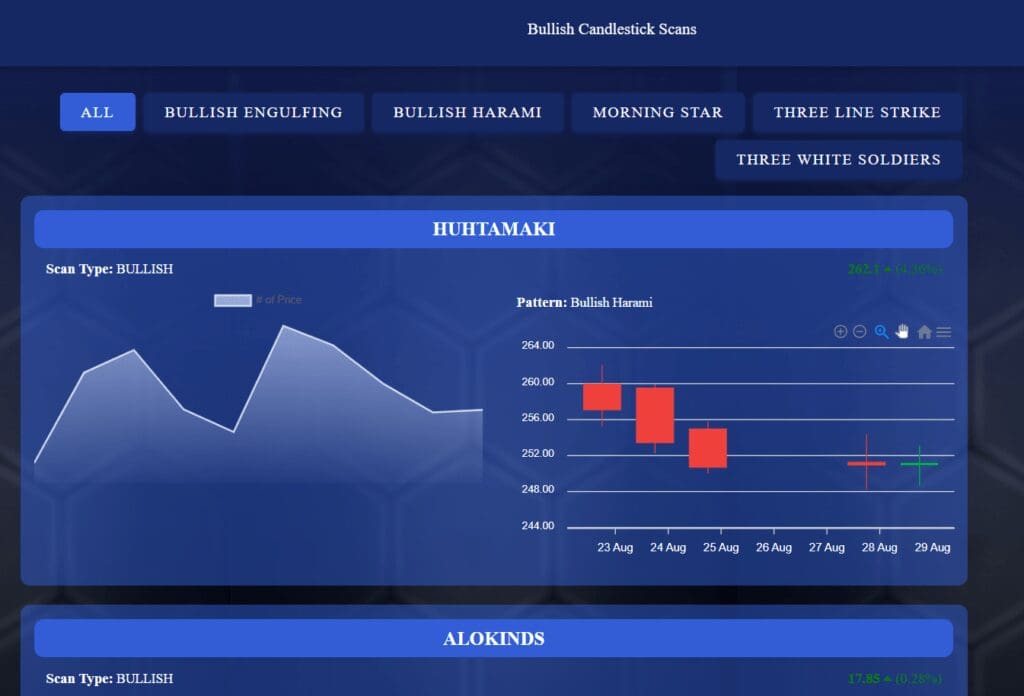
On the first page, we can see different kinds of strategies. First is All, then Bullish Engulfing, Bullish Harami, Morning Star, Three Line Strike and Three White Soldiers. A trader can prefer any of these bullish scans during the bull run and invest in the stock. It may give a good return. All these bullish scans are very popular among traders. Experienced traders also use such strategies to maximise their gain from the Stock Market. Our subscribers will get such information at their fingertips and extract gain easily.
Bearish Candlestick Scan
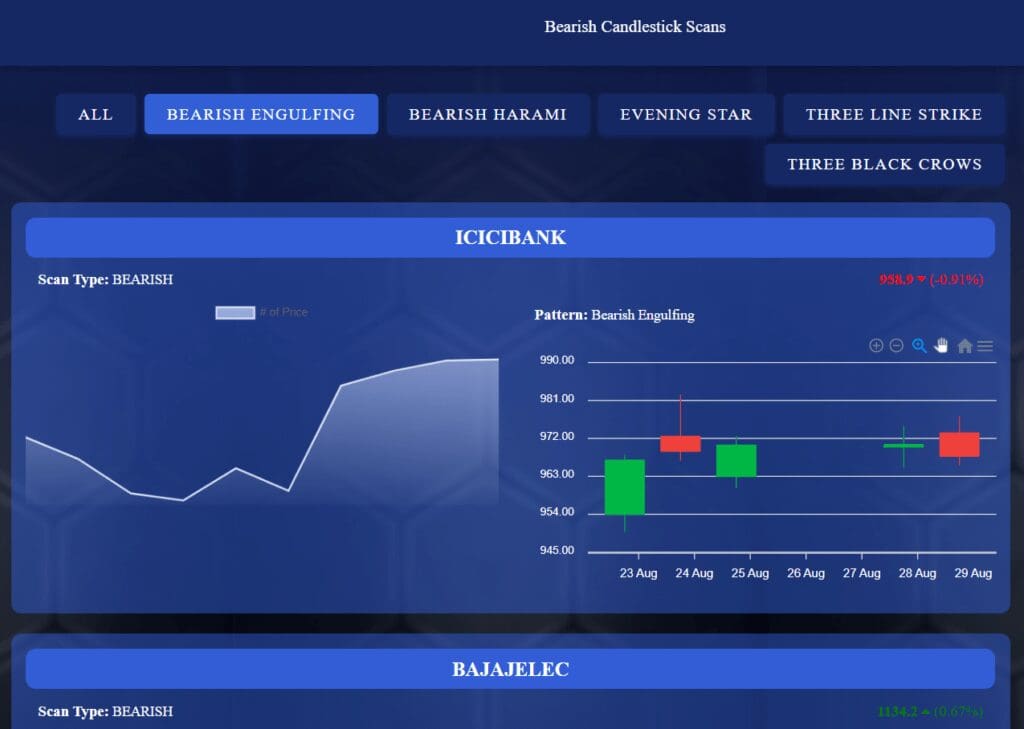
This is a bearish scan. This is mostly applicable in a bearish market. The image shows the scan result of Bearish Engulfing Scans. You can see that there is a Doji candle just before the last candle. This shows indecision among traders. Then the last candle appears to be a big bearish candle. This sequential candle pattern shows an imminent bearish trend.
After this scan, there are other types of scans. There is Bearish Harami, Evening Star, Three Line Strike and Three Black Crows. All these are popular bearish Candlestick Scans. A trader can opt for any kind of bearish scan and check the result. All these scans are the result of scanning of daily charts. All these are a part of the End Of Day Scanner.
Index Analysis
Many traders prefer to trade in Indexes. In addition, the Index shows the overall reflection of traders’ mood. Proper analysis of the index may give the upcoming market trend.
Index Analysis shows analysis of two indices, Nifty and Bank Nifty. If you click on Nifty, you will go to another page.
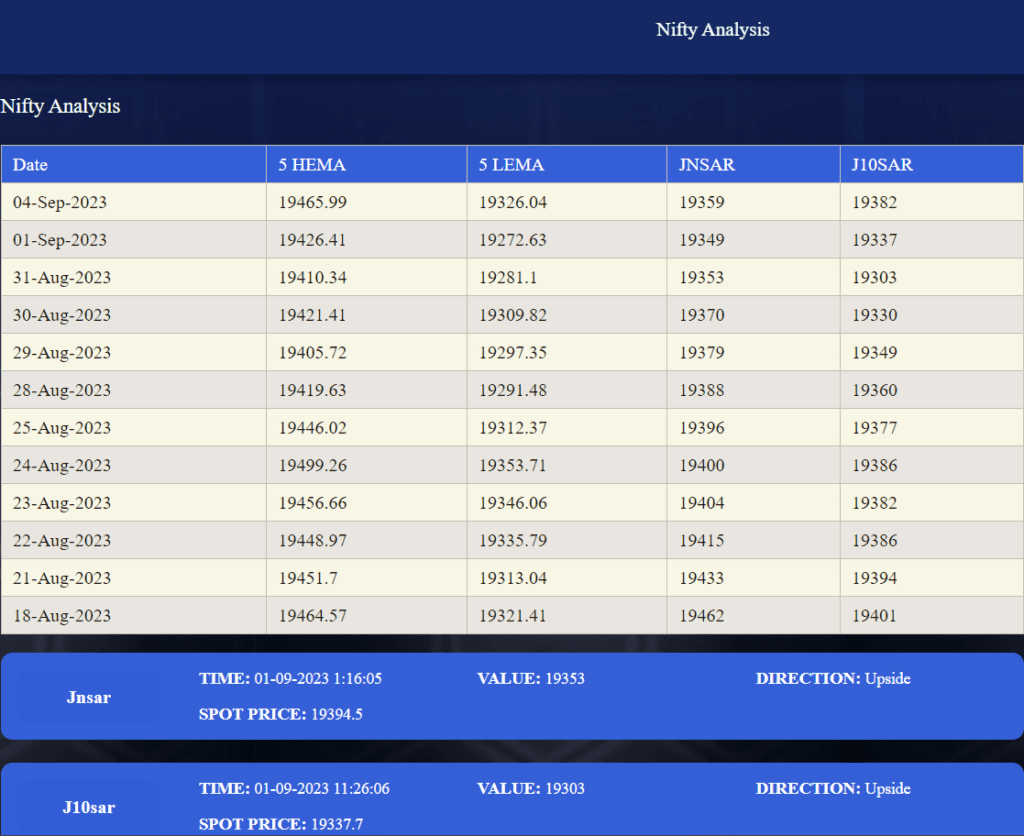
We can see there are four heads under which the index was analysed. These are 5 HEMA, 5 LEMA, JNSAR and J10SAR. All these are different parameters used to identify the index trend and analyse accordingly. These parameters show a comparative study of market strengths and weaknesses and a balance between demand and supply.
Specific numbers show the current status. If the current index is above the numbers shown by these parameters, the market is in an upside trend. Similarly, the indices will be in a downtrend if the current index is below these parameters. In addition, just below the table, we can see there is a table showing market momentum. The index is poised for a strong upside trend if the market momentum is positive along with HEMA, LEMA, JNSAR and J10SAR.
The Bank Nifty also shows similar analysis parameters if you select this index. Also, the analysis results will be similarly analysed.
Algo Alerts of Hot Tips App, the Best Stock Trading App for Beginners
The Algo Alerts is also an extremely popular section of this magnificent app. It is one of the many reasons market participants say that this app is the best stock trading app for beginners. The app produces algorithmic signals based on its in-built proprietary algorithm. When you subscribe to this app, Algo Alerts will pop up on your mobile screen instantly on a regular basis. The Algo alerts section has time stamps on it. Additionally, the alerts show entry and exit times at the instant the call is generated by the system.
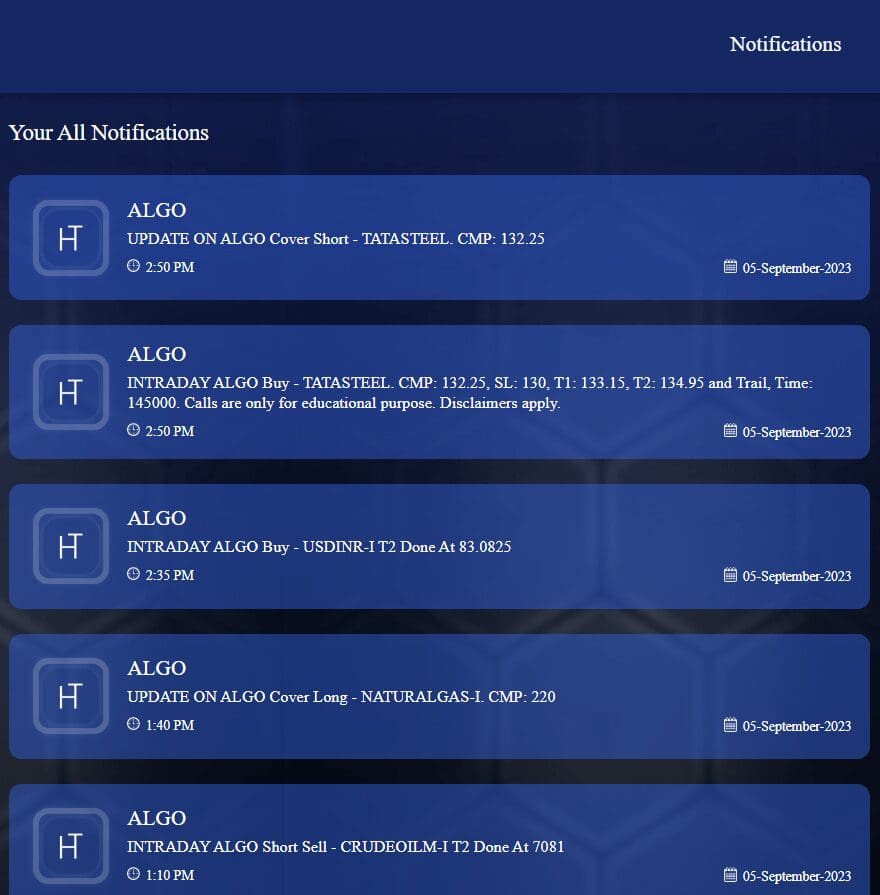
Let’s have a closer look at the above image. It says these are Notifications and Your All Notifications. The page has all notifications since the start of the trading day. There are Buy, Cover Long, Cover Short and Short Sell signals. These indicate the type of calls and the time of call generation. All Algo Alerts contain the scrip identity, time of call generation, nature of the call, CMP, targets by T1 and T2 showing the first and second target, and time of execution if the calls are closed.
There will be calls if a call is not performing mentioning when to exit and show a reverse call if it is there. No calls remain unattended by the system after the call generation, Entry and exit times and prices are specifically mentioned to avoid any confusion. These calls have high accuracy. But if a trader follows these calls and executes them, it needs to be done at the trader’s risk. We do not recommend to go by our calls. These calls are system-generated and no human interference is associated with them.
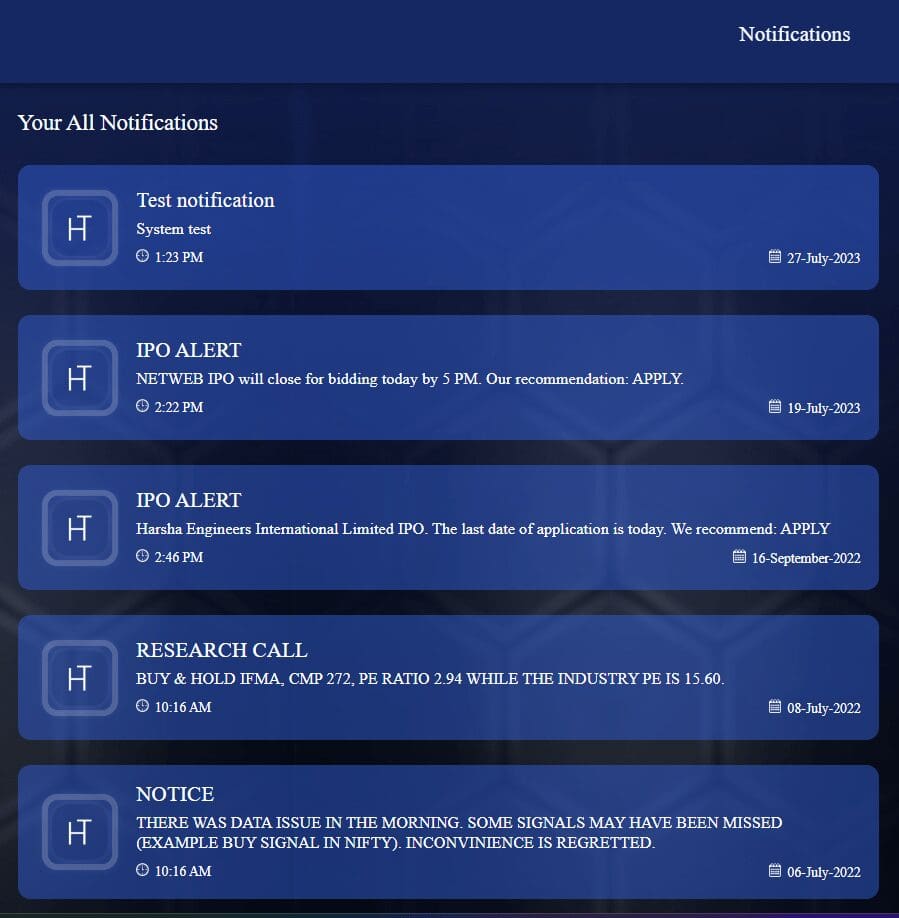
Market Alerts
This part of the Hot Tips App shows notifications sent from the app centre. Such notifications may include specific IPO Alerts, Research Calls, System notifications, signal interruptions due to network connectivity and Data issues. In addition, there may be notifications on specific segments like Expire Day Calls, Specific Market alerts, Hero Or Zero calls and any other notification sent from the System end.
Today Hot Stocks
Today Hot Stocks is a truly magnificent analytical representation of the stock movement. Each and every stock is critically analysed. After scrutiny, the system comes up with the resulting analysis. Whenever a stock appears in this list, it stays until there is a system call showing the exit.
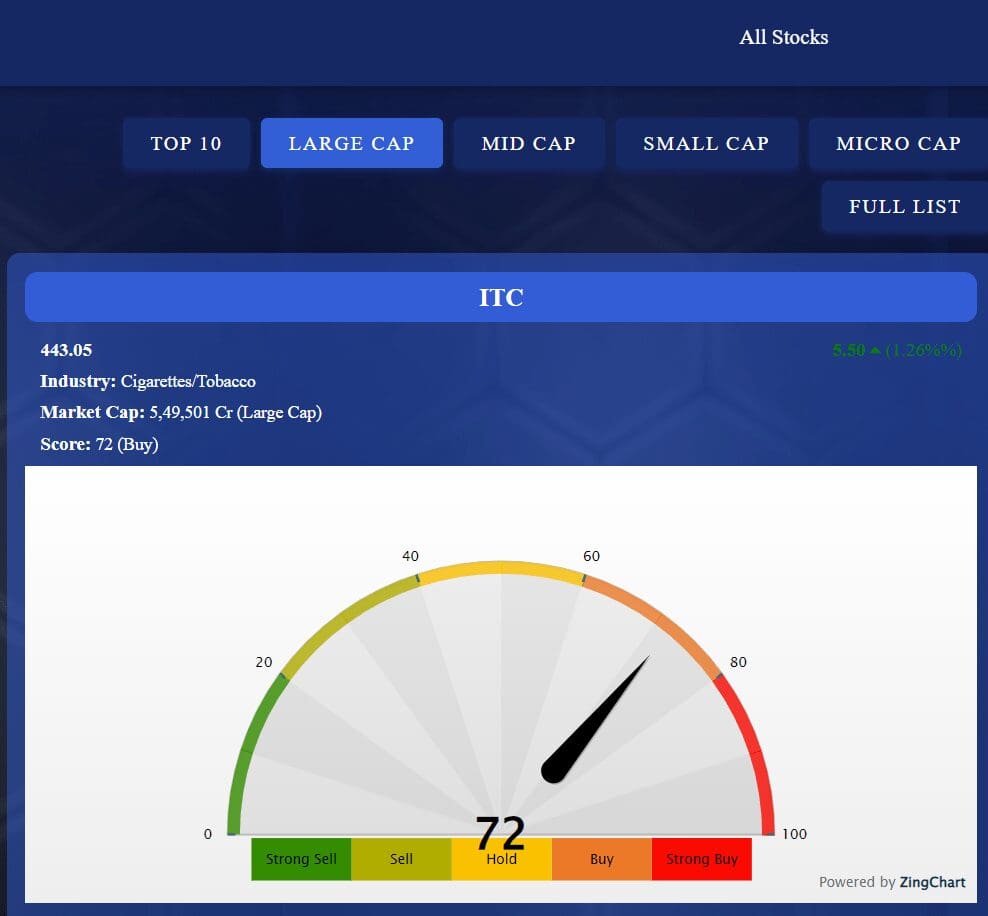
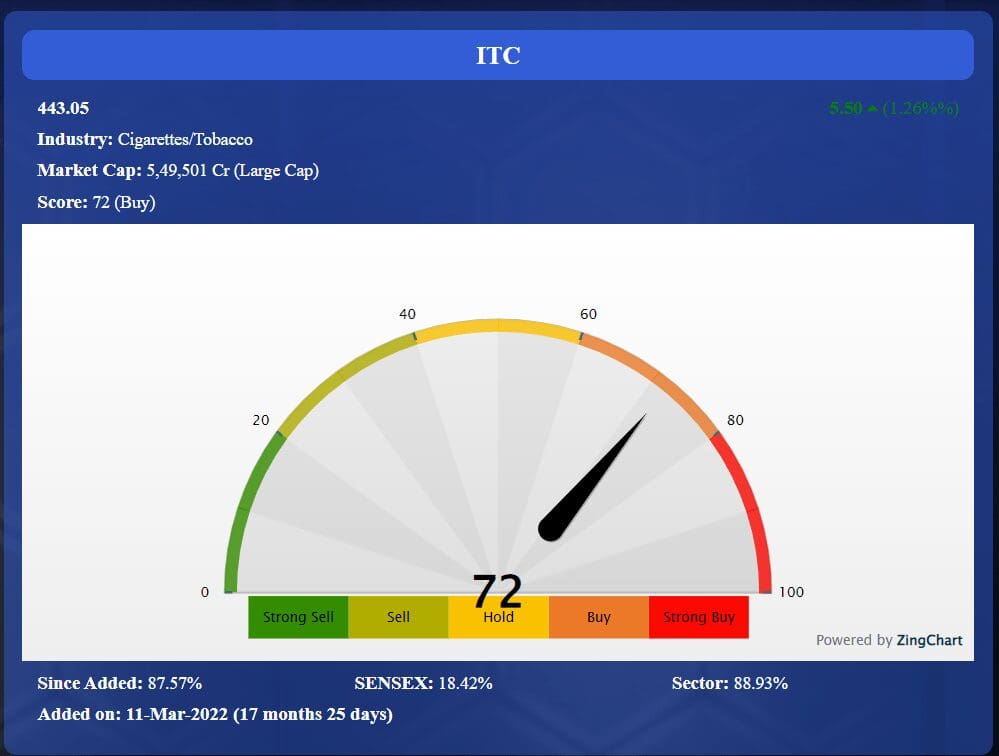
This part of the app, Today Hot Stocks shows stocks that give significant moves. We can choose from the Top 10, Large Cap, Mid Cap, Small Cap, Micro Cap and Full List. In the Large Cap section, when it was selected, we can find ITC on the top. All the relevant information is seen on the screen. The reading shows 72 which is a Buy signal. There is the CMP, market segment and market cap showing it is a Large Cap stock.
Just below, in the next image, we can see the app added the stock on 11 March 2022. In 17 months and 25 days, the stock moved up by 87.57%. Within that period Sensex moved 18.42%, and the sector performance moved up by 88.93%. This is a comparative analysis. Hence an investor can get all the relevant information if the person invested in the stock. Moreover, such data is helpful for all persons interested in stock market analysis.
Market Mood Index of the Best Stock Trading App for Beginners
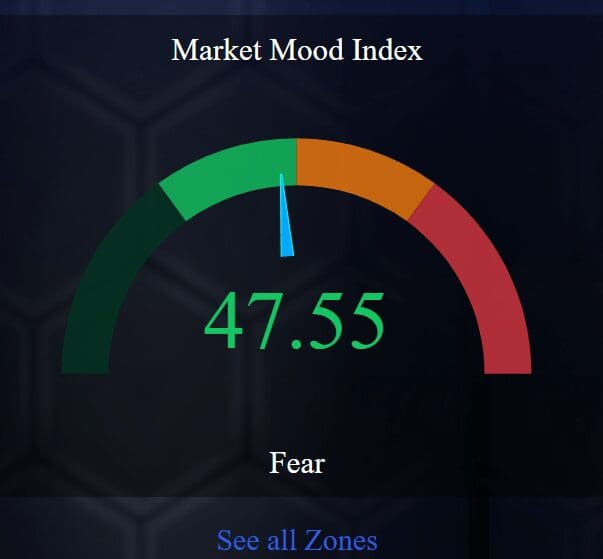
The Market Mood Index is an important part of this app. The index contains a semicircular meter with 4 scalable colour bands. Within it, there is a pointer that shows the live market status. This is a Fear and Greed indicator showing the traders’ overall sentiment.
This index is divided into four zones. Extreme Fear, Fear, Greed and Extreme Greed.
Extreme Fear
This is the lowermost band on the left. It is dark green in colour. The Extreme Fear zone occurs when the reading is below 30. It is the time when traders are fearful of more investment. The High Extreme Fear Zone occurs when the reading goes below 20. It is a time when the market is in an extremely oversold state and the market may turn upwards from this zone. It is an ideal time to start fresh investment in the market.
Fear
A reading between 30 – 50 shows the fear zone. It is light green in colour. When the index shows a Fear zone after coming up from the Extreme Fear zone, one may invest at this time.
But say, the Mood Index (MMI) is falling from the Greed zone, one should wait until the index reaches the Extreme Fear zone.
Greed
This zone has an orange colour. When MMI shows a reading between 50 – 70, fresh investment should be avoided because the market is heating up and may reach the overbought position soon. The investor should be cautious and watch positions closely.
Therefore an investor should not make new investments even if the MMI Index is coming up from below. It is time to wait and watch patiently.
Extreme Greed
The Extreme Greed band appears when the MMI shows a reading of >70. The band is red in colour. The High Extreme Greed zone appears when the MMI is 80 or above. The market has become extremely overheated if the reading shows 80 or above. Therefore, it is time to take profit from the market and wait for the market to come down.
Quick Access Points
In this area, a subscriber can go to different access links to My Profile, My Blogs and YouTube. Therefore you can access these important links directly from the Home page.
Conclusion
In conclusion, the Hot Tips App is extremely helpful for all market participants, be they traders, investors or other market participants. That is why the subscribers vote it as the best stock trading app for beginners. Though the background algorithm shows all kinds of buy, sell and exit calls, it is not recommended to trade on that basis.
We advise all traders to trade at their own risk. This app is not created to provide calls to traders. Overall, the sole purpose of creating this app is to provide deeper insight into the daily trading environment and stock movement.


