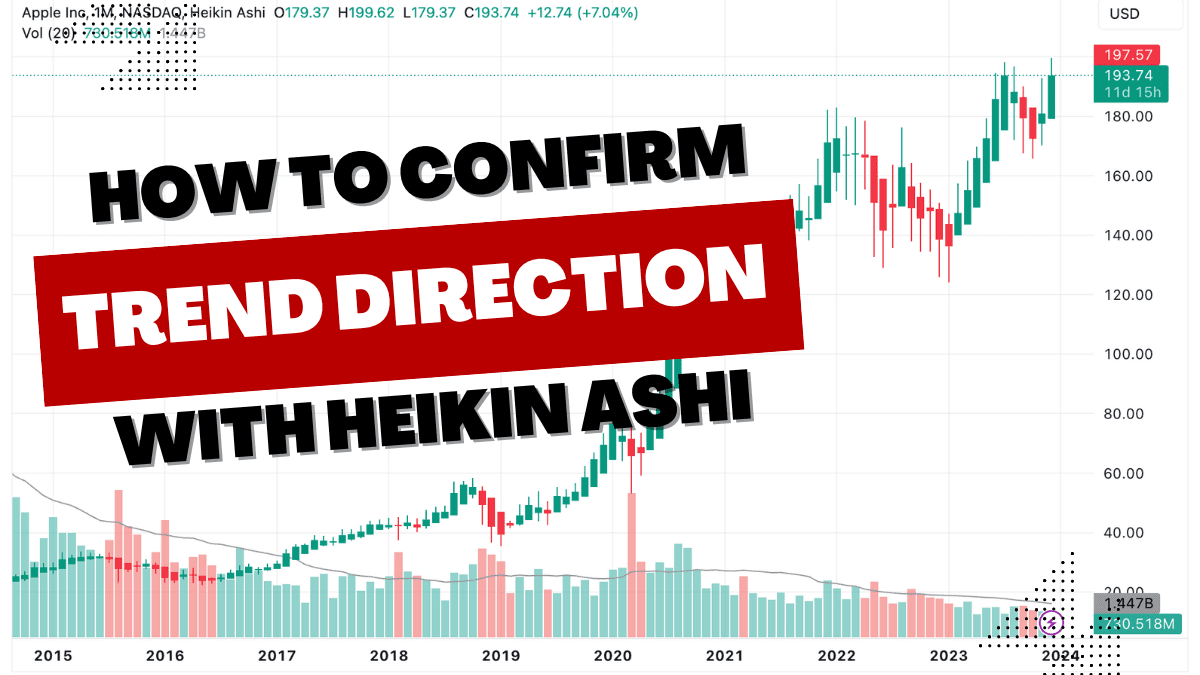
Hello, aspiring stock market savants! Venturing into the realm of stocks can feel akin to sailing uncharted waters. But worry not! Today, we’ll illuminate a path to understanding the ebbs and flows of market trends, an essential skill for your trading voyage. In this blog post, we will learn how to confirm trend direction using a simple tool called Heikin Ashi Candle.
Understanding Stock Market Trends
Imagine you’re gazing at a stock chart, with its peaks and valleys weaving a story of financial endeavour. Your mission? To decipher whether you’re witnessing an ascent to prosperity or a slippery slope to a dip. See, in the stock market’s grand theatre, identifying the trend’s script promptly and accurately is the key to a winning strategy.
What is a Trend and Why is it Fundamental?
Simply put, a trend in the stock market is the general direction in which a stock price is moving. It can be upward, signalling a bull market; downward, hinting at a bear market; or sideways, indicating a period of indecision among investors. Recognizing these trends swiftly allows traders to align with the market’s momentum, thereby making informed investment decisions.
The Significance of Trend Direction
For newcomers to the Indian stock market, the concept of trend direction is more than just a fancy term — it’s an anchor. A correctly identified trend offers you the confidence to make trades that ride the wave of market sentiment, increasing your chances of profitability.
The Traditional Approach to Confirm Trend Direction: Candlestick Charts
Initially, traders often turn to candlestick charts — a visual representation of price movements within specific time frames, detailing the open, close, high, and low points. Though informative, candlesticks can sometimes resemble a cryptic Morse code, leaving beginners lost in translation.
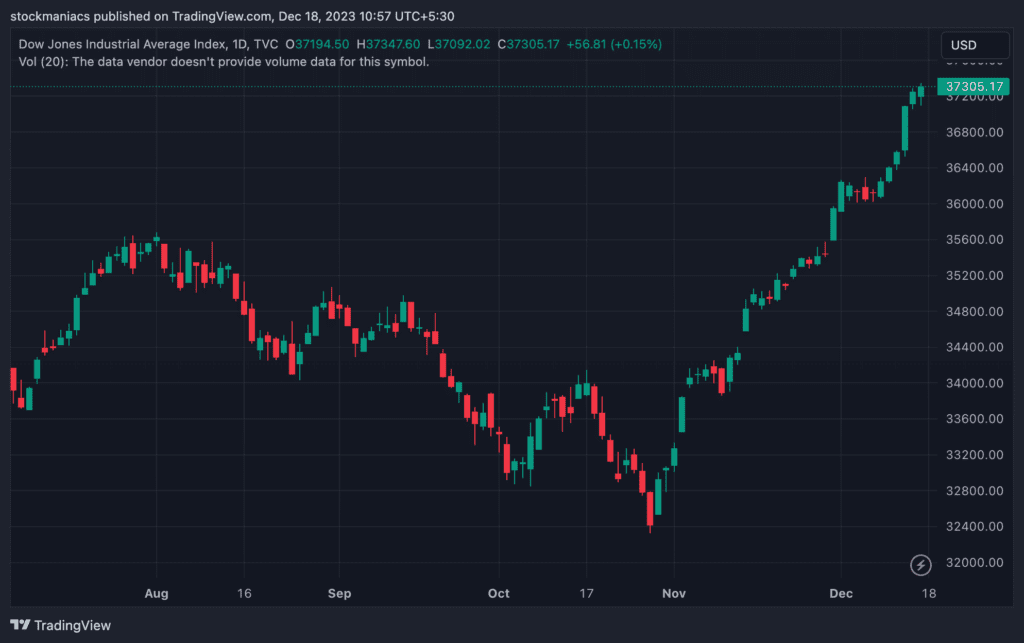
Candlestick Chart Limitations
While candlestick charts pack a wealth of information, deciphering the true trend direction amidst the noise of daily price volatility can be challenging for novices. Price highs, lows, and sideways movements can clutter your analysis, demanding more time and experience to make a decisive judgment.


Heikin-Ashi Candle: Simplifying Trend Analysis
Now, let me introduce you to a game-changing technique that streamlines trend identification — the Heikin-Ashi chart. Originating from Japan, with ‘Heikin-Ashi’ translating to ‘average bar,’ this method offers a smoothed-out view of price action, helping identify trends with less guesswork.
Heikin-Ashi Candle Chart Explained
Heikin-Ashi charts transform confusing fluctuations into a comprehensible narrative using average price components to form each bar. This results in a cleaner visual representation where:
- A green bar with no lower wick is indicative of a robust bullish trend.
- A red bar with no upper wick suggests a strong bearish trend.
- A bar with wicks on both ends denotes market indecision.
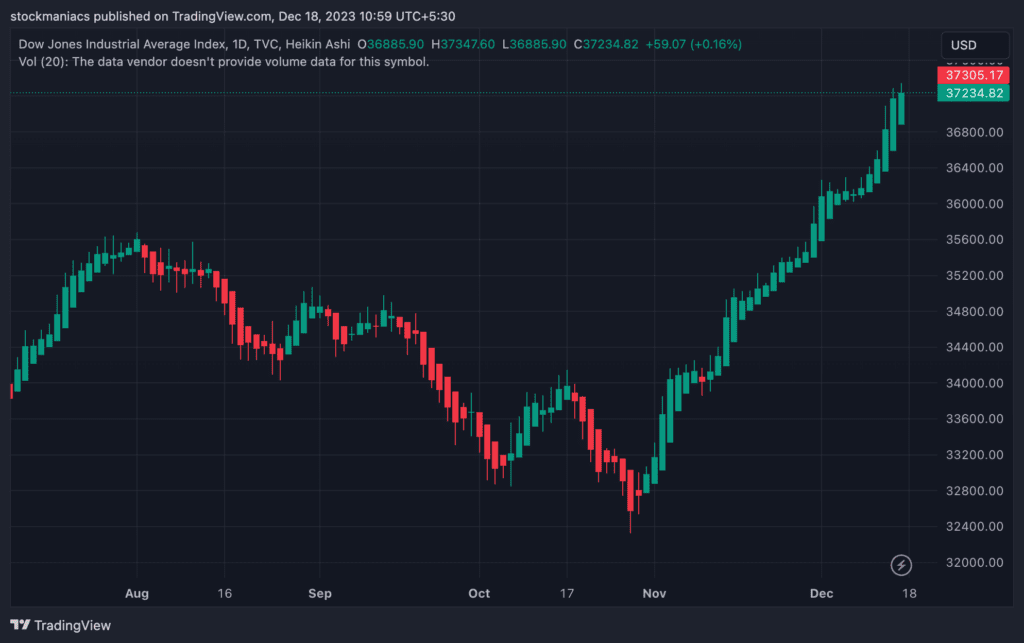
These simplistic visual cues enable traders, especially newbies, to catch the trend’s pulse without getting mired in complex candlestick pattern interpretations.
Advantages of Trend Confirmation
Utilizing Heikin-Ashi charts provides two significant advantages in confirming trend direction:
- Ease of Identification: Spotting potential trends becomes effortless with just a glance at the colour and wick composition of the bars.
- Time Efficiency: There’s no need for intricate pattern analysis or drawing trend lines, making the process quick and straightforward.
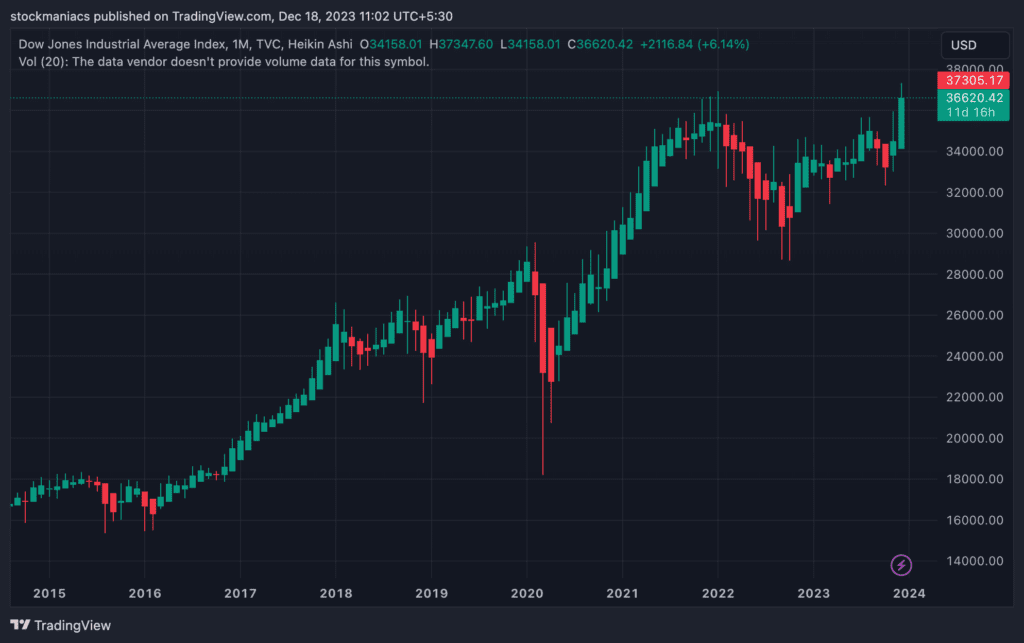
Moving to Higher Time Frames to Confirm Trend Direction
For a bird’s-eye view and improved significance, consider higher time frames like weekly or monthly charts. This approach further filters out noise, amplifying crucial trend signals.
Practical Application of Heikin-Ashi for Indian Market Newcomers
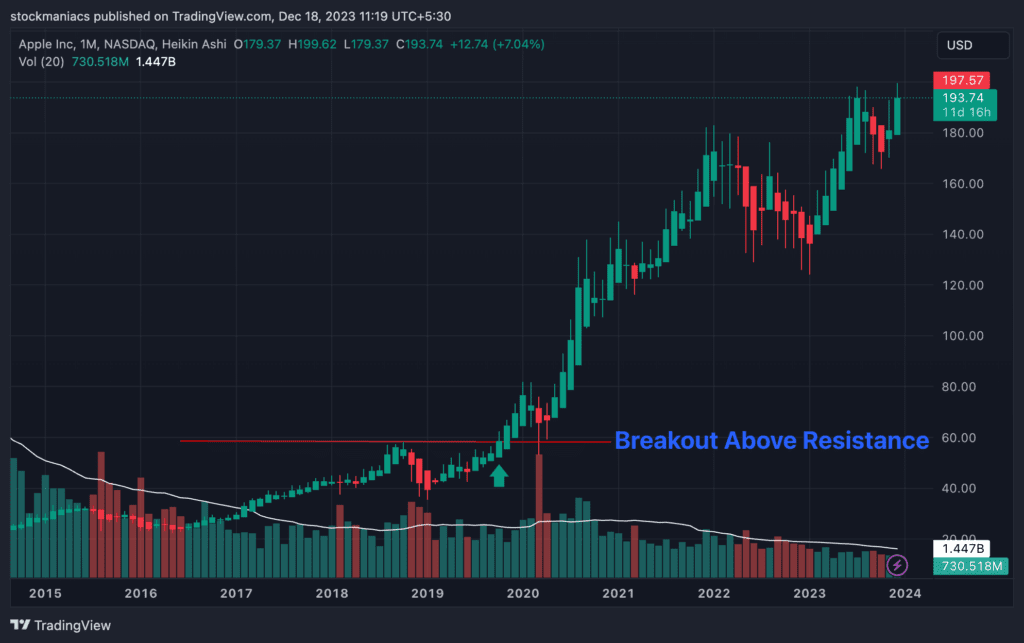
Confirming Breakouts and Breakdowns
Breakouts and breakdowns are critical junctures where stock prices escape resistance or support levels, hinting at the start of a new trend. Heikin-Ashi charts are excellent for spotting these moments. A green bar closing above a resistance level signifies a breakout, while a red bar closing below a support level might signal a breakdown.
Establishing a Trailing Stop Loss with Heikin-Ashi Candle
Another useful strategy involves setting a trailing stop loss — a dynamic exit point that moves with the price, locking in profits and limiting losses. With Heikin-Ashi, simply place the stop loss under the lowest point of the last bar without a lower wick, for long positions.
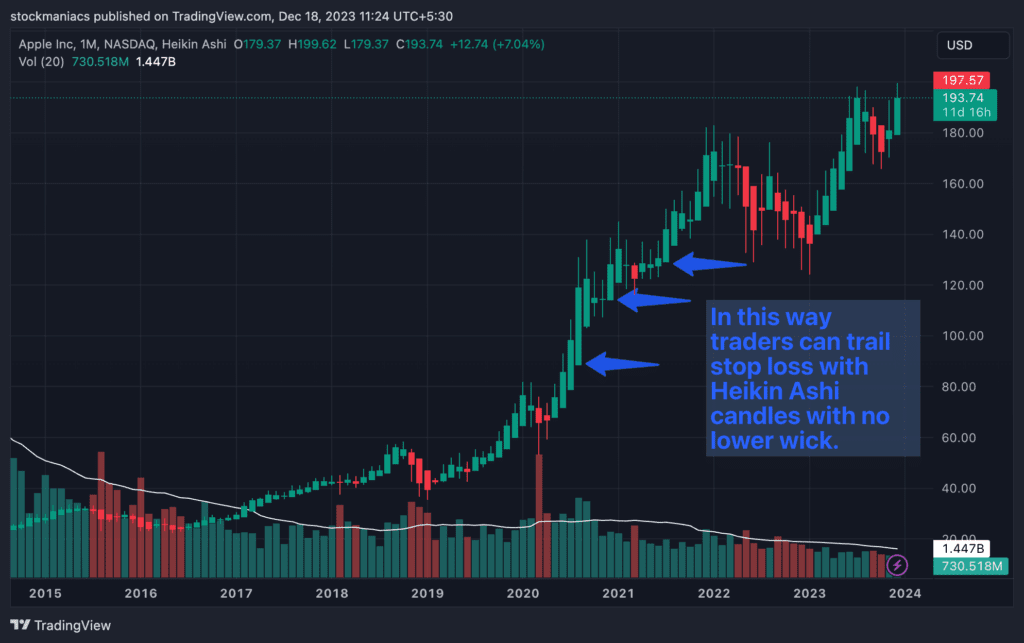
This method ensures you participate in the uptrend while protecting your investment from sudden reversals. Similarly, you can place the stop loss above the highest point of the last bar without an upper wick, for short positions.
FAQs about Trend Direction and How to Confirm it
To identify the trend direction, you can analyze charts which show price movements over time. Candlestick charts are commonly used, but Heikin Ashi charts offer a smoother representation of the trend. In Heikin Ashi charts, the presence of green bars generally indicates an uptrend and red bars suggest a possible downtrend. Looking for bars without lower wicks (green for uptrend) or without upper wicks (red for downtrend) can also be indicative of the trend’s direction.
The Heikin Ashi chart, which means “average bar” in Japanese, can serve as an indicator to confirm trends. It confirms trends by smoothing out price fluctuations and making it easier to identify bullish or bearish momentum. A green Heikin Ashi bar without a lower wick indicates a bullish trend. Similarly, a red bar without an upper wick implies a bearish trend. The presence of wicks on either side of the bar denotes indecision.
Trends can be confirmed using Heikin Ashi charts. Here a sequence of green bars without lower wicks implies a confirmed uptrend. Similarly, a series of red bars without upper wicks suggests a confirmed downtrend. Breakouts or breakdowns in price can also confirm trends; a bearish bar closing below a support zone confirms a breakdown, while a bullish bar without a lower wick closing above a swing high confirms a breakout.
Recognizing trends involves observing price charts and identifying patterns. In simple terms, an uptrend consists of higher highs and higher lows, while a downtrend consists of lower highs and lower lows. Heikin Ashi charts make trend recognition easier by displaying predominantly green bars for uptrends and red bars for downtrends, with less ‘noise’ from price fluctuations compared to traditional candlestick charts.
Conclusion: Learn to Confirm Trend Direction for Market Mastery
In conclusion, understanding trend direction is an art. Heikin-Ashi charts serve as your palette, helping paint a clearer picture amidst the complex canvas of the Indian stock market. While no single technique guarantees success, coupling Heikin-Ashi with prudent money management and a touch of patience can tilt the odds in your favour.
Remember, the keyword isn’t prediction but probability. Seek not to foretell the market’s moves, but rather to react judiciously to the clues it offers. Armed with Heikin-Ashi and a dash of market wisdom, you’re ready to pierce through the fog of uncertainty and chart your course to trading triumph.
Here’s to smooth sailing in your stock market journey. Overall, may the trends be ever in your favour! Happy trading!


