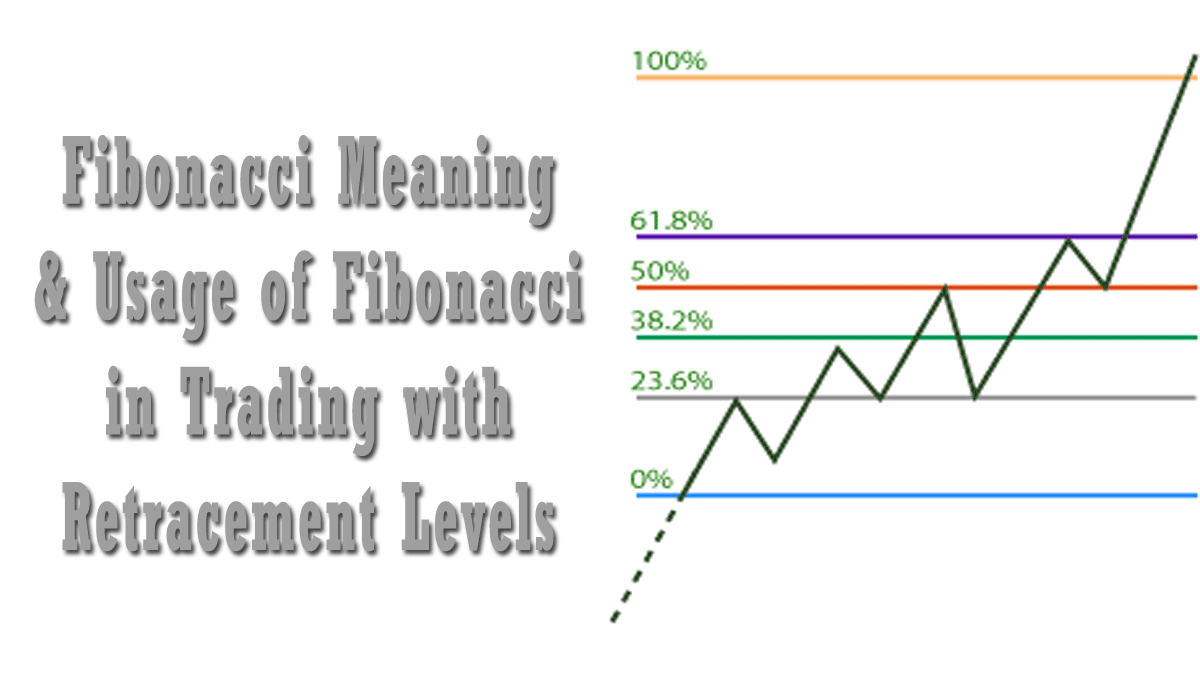
In this post, I will discuss the Fibonacci meaning and also the proper usage of Fibonacci in trading with retracement techniques. I will also see how to use it for market reversal. Using these we can beforehand calculate potential market reversal points and most of the time they are deadly accurate.
The Meaning of Fibonacci
Fibonacci Series, developed by the Italian mathematician Leonardo Pisano Bogollo, is also known as Fibonacci. Without understanding the series, you can’t go further in the Fibonacci Retracement Strategy. Hence, let’s begin with a very basic concept.
Leonardo Pisano introduced a series of interrelated numbers which starts from zero. This series includes a sequence of numbers in a specific way that the value of any number in the series is the sum of the previous two numbers.
How Does the Fibonacci Series Look Like?
0, 1, 1, 2, 3, 5, 8, 13, 21, 34, 55, 89, 144, 233, 377…
So the Fibonacci meaning is if you add the previous number you get the next number. The first number is 0 and the second number is 1. So the third number is 0+1 = 1, the fourth number is 1+1 = 2, the fifth number is 1+2 = 3 and so on.
Observe the above sequence, each number is the sum of its previous two numbers. With the progress of the sequence, a ratio develops, which refers to the golden ratio. Let us describe the entire sequential ratio below.
The Sum Rule to Understand the Meaning of Fibonacci
For example:
5+8=13
8+13=21
13+21=34
21+34=55
Golden Ratio Calculation to Understand Fibonacci Meaning
We can extend the series to infinity. The Golden Fibonacci Ratio comes from the division of any number by its previous number in the series. For example:
377/233 = 1.618
233/144 = 1.618
In order to calculate the consistency of further ratio properties, we divide a number by its immediate succeeding number and express it in percentage.
(144/233)x100 = 61.8%
(377/610)x100 = 61.8%


We can find another consistency when we divide a number by a number which is two places higher. After that, we can express it in percentages.
(13/34)x100= 38.2%
(21/55)x100= 38.2%
When a number is divided by a 3-place higher number, consistency can be seen:
(13/55)x100 =23.6%.
(21/89)x100 =23.6%.
How to Use Fibonacci in Trading?
What are the levels of Fibonacci in trading? It is a measure of possible movement between low and high OR high and low and we measure retracement of the prior move. You can easily create Fibonacci retracement technical analysis techniques in Zerodha Kite. If you do not have an account in Zerodha click here to get one.
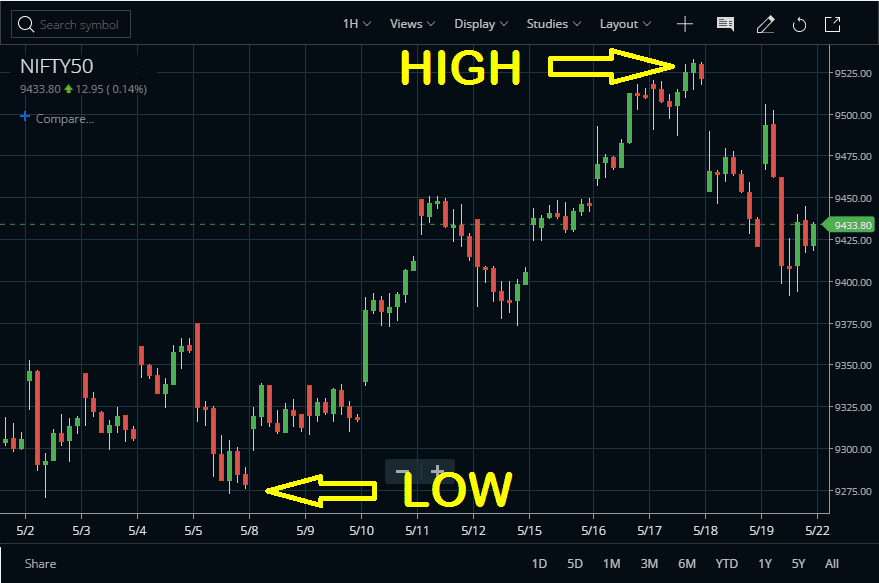
First, identify a low and high in the chart using your favourite charting software. See the image below:
In Zerodha Kite click on the DRAW button and this will activate the SELECT TOOL menu in your chart.
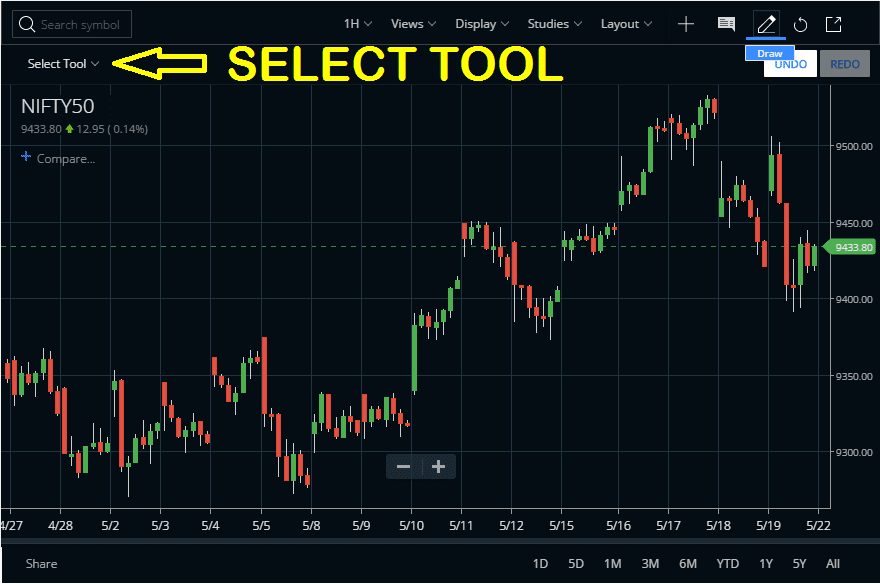
Activate FIBONACCI from the SELECT TOOL option. If you want the retracement levels from the last high, then first click on the low and drag the mouse to the high. This will also create Fibonacci retracement levels from the high.

Trading with Fibonacci Retracement Technique for Market Reversal
Let’s see a practical example. In 2008 Nifty index made a high near 6300 and from there, a major fall happened. So this became a supply zone for Nifty. So when Nifty once again moved up to that zone in 2010 Deepavali many traders sold close to that supply zone. While selling you can calculate the targets using the Fibonacci retracement techniques. Locate the last low. See the image below:
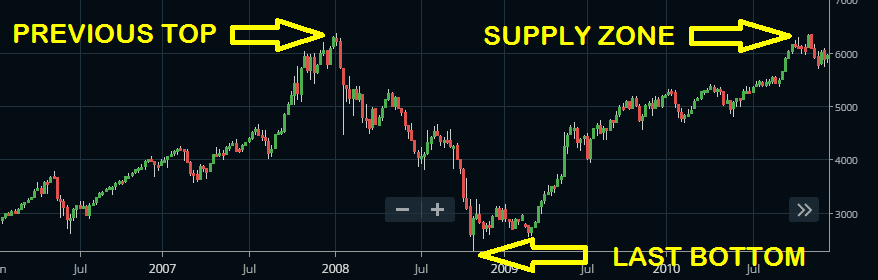
In general, 3 Fibonacci retracement levels are important. First support will come at 38.2%, second at 50% and third at 61.8%. So if selling at a supply zone OR buying at a support zone these levels can be the targets.
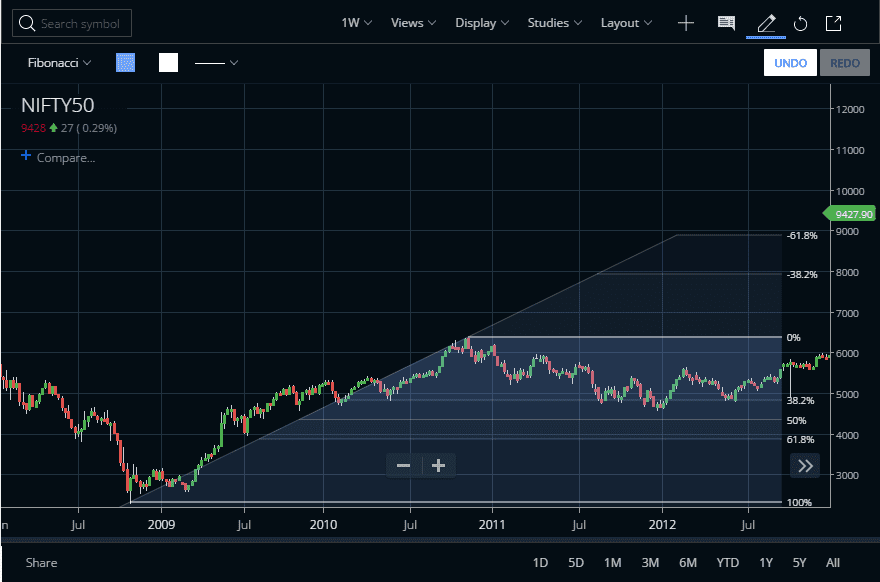
Now check the image above, how Nifty exactly took support at 38.2% retracement zone after correcting from the supply area.
Tools Used for Fibonacci in Trading
The Fibonacci sequence is quite a popular tool in the stock market. There are certain tools, based on Fibonacci, such as Fibonacci Retracements, Fibonacci Arcs, Fibonacci Fans, and Fibonacci Time Extensions. The centre point of the article is the Fibonacci Retracements. The first question that may arise about the subject is what we mean by the term “retracement”. A retracement refers to a temporary reversal against the prevailing trend. For instance, during an uptrend, a brief period of retracement is also known as a dip.
Fibonacci retracements are the simple and widely used Fibonacci tool. Besides identifying the support-resistance level, target and stop-loss are also important outcomes from it. After applying the retracements tool, some horizontal lines appear along with the indications of the support-resistance level. The calculation is done by the first locating high-low of the chart.
More Examples of Usage of Fibonacci in Trading Using Retracement

In order to clear the subject, two sets of images are attached. Observe the first image where the support-resistance level is clearly shown in the ratios of 23.6%, 50%, and 38.2%. The tool carries a very simple strategy. Here, at the 23.6% level after getting resistance, the price will go up and come back to the previous 23.6% level as a support. The retracement is clearly shown here.
For the next example, after applying the Fibonacci line on the NIFTY 50 chart, I have taken a screenshot from Zerodha Kite Web. You may see it from Kite mobile app also.

As you can see in the above chart, as the price recently falls from an up-trend position, if you sell at this moment, you can take 1st support at 38.2%, 2nd support at 50% and 3rd support at 61.8%. 50% and 61.8% are considered the most significant points. Here, one thing should be clear to you, support can also work as a resistance level too during an uptrend.
Features of Fibonacci Retracement Strategy
- One of the most simple models among the Fibonacci tools.
- Identify the support-resistance level.
- Besides support resistance, the target–stop loss is also a significant outcome.
- We can easily find an entry-exit point here.
- Traders can apply this tool in future and options also.
Suggested Reading on the Meaning and Trading Fibonacci
We recommend reading the following book from Amazon. The ebook link is given here: Fibonacci Trading: How to Master the Time and Price Advantage.
Download Sample Chapter – 36 Page Ebook
Download a 36-page sample chapter to know more about the trade setups using the Fibonacci retracement strategy. This is taken from chapter 7 of a full ebook “Fibonacci Trading” by Carolyn Boroden. Access the download link here.
Conclusion
In conclusion, this overview regarding the Fibonacci Retracement Strategy will guide you to find the proper support resistance in a stock. Also, sometimes, the calculation might get tricky for you, you may apply our Fibonacci calculator for the easy calculation method. Finally, I will love to answer your queries in the comment section below.


How to draw Fibonacci from Top to Bottom or from Bottom to Top. For how many days chart (Period).
Jitendra, at least 200-300 bars are required for a 2 wave pattern. Bottom to top OR top to bottom. So if you are trading on daily bars use a 1-2 years time period. If you are using weekly bars at least 3 years charts are necessary.
How to apply Fibonacci in intraday trading
Jalpak, in intraday charts identify a potential top or bottom. Then try to locate next potential bottom or top. You can try specific candle patterns like pin bar OR can use heikin ashi colour change. Then draw a fibonacci to locate retracement points.
thank you very much . quite informative and understandable
Welcome.