How to Trade the High Low Bands Indicator?

High Low Bands Indicator

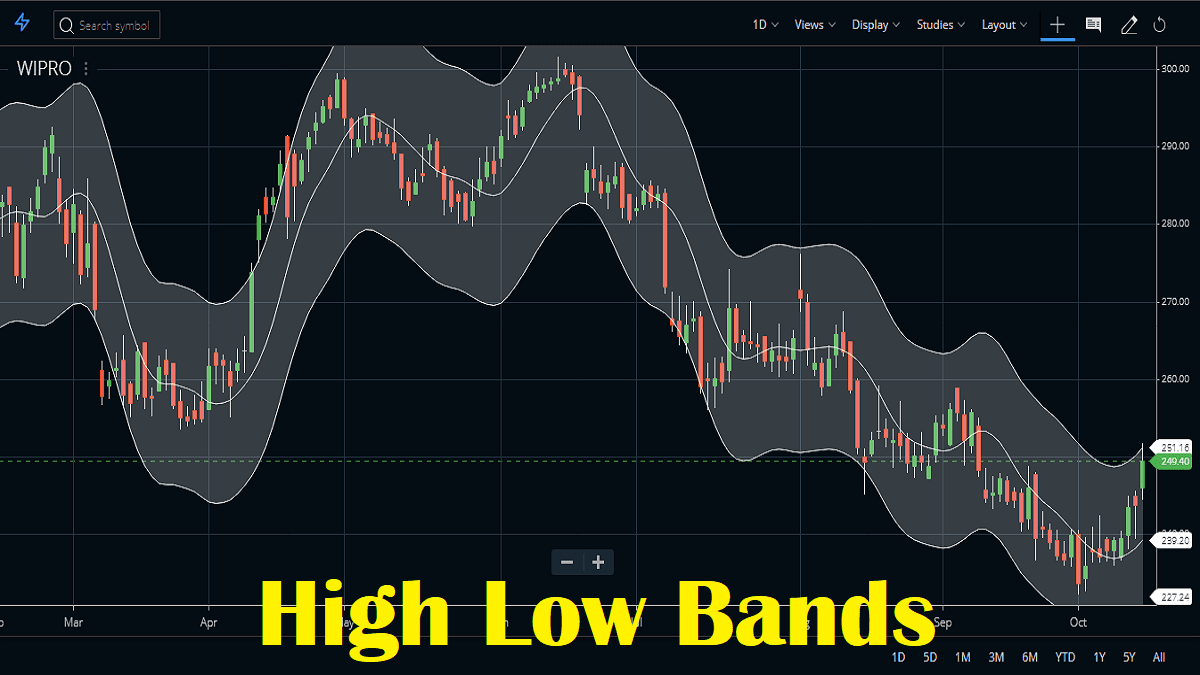
In High Low Bands Indicator or HLB, there are two bands surrounding the underlying’s price, and its generated from the triangular moving averages calculated from the underlying price. In this indicator, the triangular moving average is, in turn, shifted up and down by a fixed percentage. What is the High Low Bands indicator? Mainly concept … Read more

Gopalakrishnan Range Index (GAPO) Usage Guide

Gopalakrishnan Range Index In Zerodha Kite

Gopalakrishnan Range Index or GAPO is developed by Jayanthi Gopalakrishnan in the January 2001 issue of the STOCKS & COMMODITIES magazine. It attempts to determine the variability of price data based on the log of the price range over user-defined n-periods. Gopalakrishnan Range Index is intended to measure volatility in a stock or commodity. It does … Read more

How to Trade Bill William’s Gator Oscillator?

Gator Oscillator in Zerodha Kite Indicator

The Gator oscillator is a stock or forex trading tool that is developed by Bill Williams. This Oscillator is an auxiliary oscillator to the mighty Alligator indicator. It is most useful in markets that display strong directional action. This oscillator is presented as a histogram with red and green bars. It was originally presented in … Read more

Fractal Chaos Bands Indicator Formula, Strategy

Fractal Chaos Bands Indicator In Zerodha Kite

The Fractal Chaos Bands Indicator is a trend overlay. The stock market moves in a highly chaotic way. But at a larger scale, the movements follow a certain pattern that can be applied to shorter or longer periods of time. This technical indicator shows an overall scenario of the price action by filtering out the … Read more

Elder Ray Index Indicator Formula and Settings

Elder Ray Index Indicator in Zerodha Kite

Once again, the Elder-Ray Index is an indicator developed by Alexander Elder. It measures the amount of buying and selling pressure in the market. The components of the Elder Ray Index indicator are “bull power” or “bear power”. The main part of this indicator is an exponential moving average, which is a trend-following indicator essential to the calculation. … Read more

How to Trade the Elder Impulse System Indicator?

Elder Impulse System Indicator

After Force Index and Fisher Transform the Elder Impulse System indicator was also developed and described by Alexander Elder in his books. It’s based on two popular indicators – a 13-period Exponential Moving Average (EMA) and a histogram MACD. The Elder Impulse System uses the Ema indicator for defining a short-term trend and the MACD-Histogram measures momentum. This … Read more

Elder Force Index Indicator Usage Guide

Elder Force Index Indicator

The Elder Force Index is an indicator that uses price and volume to assess the power of a move or vary in turning points. It is developed by the veteran trader Alexander Elder. It was introduced in Alexander Elder’s classic book, Trading for a Living: Psychology, Trading Tactics, Money Management (Wiley Finance). The Force Index has … Read more

Ehler Fisher Transform Indicator Formula, Strategy

Ehler Fisher Transform Indicator

Ehler Fisher Transform indicator is designed to clearly spot major price reversals and visualize them. It is also a leading/lagging indicator of all the indicators present in Zerodha Kite. This is reflected in spots where the rate of change is the biggest. It is an indicator built on an oscillator that was developed by John Ehler, the … Read more

Ease of Movement Indicator Formula, Strategy

Ease of Movement Indicator in Zerodha Kite

The Ease of Movement indicator or EMV is a volume-based oscillator that fluctuates above and below the zero lines. This indicator is designed to measure the “ease” of price movement. Richard Arms created Equivolume charts to visually display price ranges and volume. It takes Equivolume to the next step by quantifying the price/volume relationship and showing … Read more

Donchian Width Indicator Strategy, Formula, Usage

Donchian Channel Width

We have already discussed the DC or Donchian Channel indicator in our last post. The next indicator that is available in Zerodha Kite and other major trading platforms is the Donchian Width indicator (DW). It’s a less known and less used indicator but Zerodha has cleverly introduced this in their new Kite interface. How To … Read more

Donchian Channel Indicator: Learn How to Trade it

The Donchian Channel indicator was developed by Richard Donchian. It is a technical momentum pointer that calculates the higher highs and lower lows of a specific period of time forming a channel around those values with upper and lower bands. When the traders use this indicator, generally 20-period highs and lows are considered. Also, a … Read more

🟣 Zerodha Best Overall 🟢 FYERS Best Charts 🔵 Upstox Beginner Friendly