Williams Percent R Indicator: Calculation, Strategy

Williams Percent R Indicator (%R)

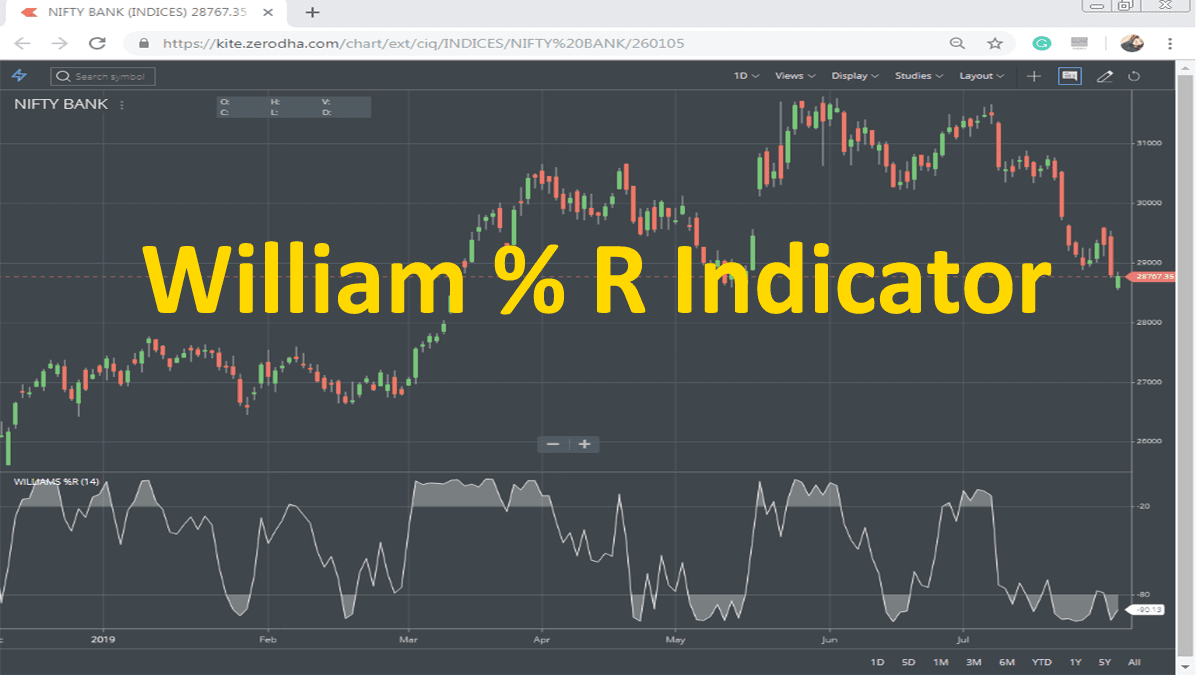
The Williams Percent R indicator, often referred to as simply the β€œ%R” is a momentum oscillator developed by Larry Williams that measures overbought/oversold levels on a scale of 0 to -100. It compares the current closing price with the highest high and lowest low for a look-back period; usually 14 days. The %R can then … Read more

Vortex Indicator (Formula, Usage and Strategy)

Vortex Indicator

Etienne Botes and Douglas Siepman developed the vortex indicator. It consists of two oscillating lines.Β In these oscillators, one identifies positive price movement, and the other identifies negative price movement. The indicator is a volatility-adjusted trending indicator. So, the Indicator is a unique directional indicator that gives clear signals. It defines the overall trend. As with … Read more

ZigZag Indicator Usage, Calculations Details

ZigZag Indicator

The ZigZag indicator is a very diverse indicator. It allows for a huge versatility in both trading and analysis.Β This indicator can be used to filter out relatively small price movements.Β The indicator is what is known as a filtering or smoothing indicator. Here, you will get to know about the indicator usage, settings, and detail. The … Read more

Volume Oscillator Indicator Basic Strategy, Settings

Volume Oscillator Indicator

The Volume Oscillator indicator is a volume-based technical indicator. This indicator works on the technical premise that it is not the actual level of volume, but the change in volume relative to the recent past that has more technical significance. FAQ Features of the Volume Oscillator How to Set Up the Volume Oscillator on Charts? … Read more

Weighted Close Indicator Strategy with Examples

Weighted Close Indicator

The Weighted Close indicator (WCI) is the average of High, Low, and doubled Closing prices. The same as in Typical Price, Weighted Close is the technical tool that measures the mean change in a security’s price. The Weighted Closed indicator’s main purpose is to filter the Moving Average System. FAQ How to Attach the Weighted … Read more

Trading the Volume Rate of Change (Volume ROC)

Volume Rate of Change Indicator

Omega introduced the Volume Rate of Change indicator in the year 1997. This indicator uses the current volume and a prior volume to create an oscillator that is plotted as a histogram. The traders may change the input as well as the period length. FAQ How To Attach Volume Rate of Change Indicator On Chart? … Read more

Volume Underlay Indicator Usage, Trading Strategy

Volume Underlay Indicator

The Volume Underlay indicator mainly shows the total volume as a bar chart beneath each of the chart’s periods. Unlike all other indicators that display in a sub-window, the Volume Underlay indicator displays within the actual chart. Before stepping into the main discussion regarding the specific indicator let’s just have a quick idea about the … Read more

Volume Weighted Average Price or VWAP Indicator

Volume Weighted Average Price Indicator

Volume Weighted Average Price indicator is a technical analysis tool. One can use it to measure the average price weighted by volume. The volume-weighted average price (VWAP) indicator mainly works with intraday charts as a way to determine the general direction of intraday prices. VWAP indicator is similar to a moving average when the price … Read more

Vertical Horizontal Filter Indicator Strategy, Formula

Vertical Horizontal Filter Indicator Formula & Usage

In 1991, Adam White developed the Vertical Horizontal Filter indicator (VHF). Traders can use this indicator in technical analysis to recognize periods when the price is trending (up-trend or downtrend) or this indicator is in the congestion phase (side-way trend). This was first published in a magazine called β€œIssues of Futures”. Traders use the indicator … Read more

Mastering the Ultimate Oscillator Indicator

Ultimate Oscillator

Larry Williams developed the Ultimate Oscillator Indicator in 1976. This was featured in Stocks and Commodities Magazine in 1985. The Ultimate Oscillator is a momentum oscillator that was designed to capture momentum across three different time frames. The multiple time frame of this oscillator seeks to avoid the pitfalls of other oscillators. FAQ How to … Read more

Ulcer Index Indicator Rules and Formula, Strategy

Ulcer Index Indicator

Peter Martin and Byron McCann developed the Ulcer Index Indicator in 1987. This is a volatility indicator that measures downside risk. This indicator was first introduced in 1989 in Investor’s Guide to Fidelity Funds. Basically, the index is designed with mutual funds in mind. This is why it only focuses on downside risk. What is … Read more

🟣 Zerodha Best Overall 🟒 FYERS Best Charts πŸ”΅ Upstox Beginner Friendly