Linear Regression Slope Indicator Strategy & FAQ

Linear Regression Slope Indicator

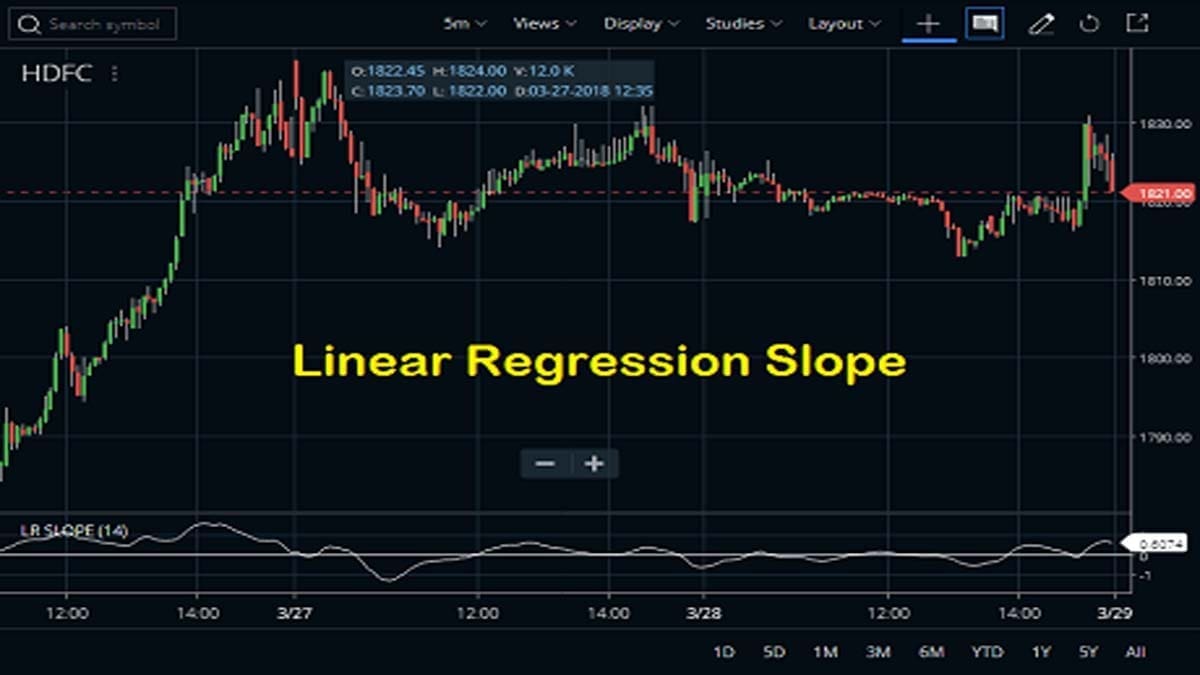
Linear Regression Slope Indicator is one of the technical indicators using the linear regression (LR) technique which is used in a few other pointers. The slope value is crucial if one is comparing the market that trades within different ranges. The normalized slope value actually reflects the price change per bar of the regression line. … Read more

Linear Regression R2 Indicator Trading Guide

Linear Regression R2 Indicator

Linear Regression R2 indicator is used to ascertain the strength of the dominant market trend. The indicator also follows the Linear Regression technique. We have already seen the usage of Linear Regression in the Forecast type and also in the Intercept version of the indicator. LR R2 indicator is used to determine the intensity of … Read more

Linear Regression Intercept Indicator Usage Guide

Linear Regression Intercept indicator is one type of indicator that is once again calculated by using the Linear Regression or LR technique the same as the Linear Reg Forecast Indicator. The statistical tool helps traders to predict the future value of assets. You can use the tool as a quantitative way to identify the underlying … Read more

How to use Linear Regression Forecast Indicator?

Linear Regression Forecast Indicator pic

The Linear Reg Forecast Indicator is the short name for Linear Regression Forecast Indicator. Here, the underlying indicator is linear regression, which is a statistical tool. Mainly it helps in predicting future price values from past price values. Therefore, the indicator performs regression analysis on optionally smoothed price data and forecasts the regression lines if … Read more

Klinger Volume Oscillator Calculation, Strategy

Klinger Volume Oscillator

The Klinger Volume Oscillator (KVO) is a confirmation indicator. Stephen J. Klinger developed the indicator. The Klinger Volume Oscillator uses high, low, close, and volume to create a force of volume. The popular oscillator helps to forecast an upcoming reversal by using volume and price. Traders can use this to point out short-term fluctuations as … Read more

Keltner Channel Indicator Trading Guide

Keltner Channel Indicator In Zerodha Kite

The Keltner Channel indicator is very popular among traders as a technical pointer. Traders are using this to assess the stock or commodity’s trend. It can spot potential reversal points and can also provide trade signals. It is also a volatility-based envelope set above and below an exponential moving average. So, the indicator was first … Read more

How to Trade Intraday Momentum Index Indicator?

Intraday Momentum Index In Zerodha Kite

Tushar Chande first developed the Intraday Momentum Index (IMI) in his book “The New Technical Trader“. The indicator belongs to the oscillator family. Traders found the indicator almost similar to RSI or Relative Strength Index. I will discuss the similarity later. First, let’s break down the definition of the indicator first. Then we will move … Read more

Ichimoku Cloud Indicator Trading Strategies

Ichimoku Kinko Hyo

The Ichimoku Cloud is also known as Ichimoku Kinko Hyo. It is a versatile indicator that defines support and resistance. It also identifies trend direction, gauges momentum, and provides trading signals, which is translated into a “one look equilibrium chart” and chartists can identify the trend and look for potential signals within that trend. Goichi Hosoda, who … Read more

Historical Volatility Indicator Features & Strategy

Historical Volatility (HV) Indicator

To know the Historical Volatility Indicator, first, we need to touch on the basic concept of the term “Volatility”. It is the most important term, used in the stock markets. Many investors use this tool to manage their risk. It is simpler terms, Volatility means the fluctuation in a stock’s or any other underlying price, … Read more

Highest High Value Indicator: How to Trade HHV?

Highest High Value (HHV) Indicator

Highest high-value indicator or in short form HHV means that the stock has hit an all-time peak since it is listed and it indicates that there is big demand at that particular time for that particular stock. In this indicator, the default period is 14. The Highest High-Value indicator returns the highest high price over user-defined … Read more

High Minus Low Indicator Formula & Strategy

High Minus Low Indicator In Zerodha Kite

High Minus Low indicator (HML) can help an investor or trader to identify the range of security or stock. It actually plots the difference between the stock’s high of the day and low of the day and plots the range of the day. it looks like a zigzag line with sudden spikes. Those sudden spikes represent … Read more

🟣 Zerodha Best Overall 🟢 FYERS Best Charts 🔵 Upstox Beginner Friendly