Price Momentum Oscillator Calculation & Strategy

Price Momentum Oscillator Indicator

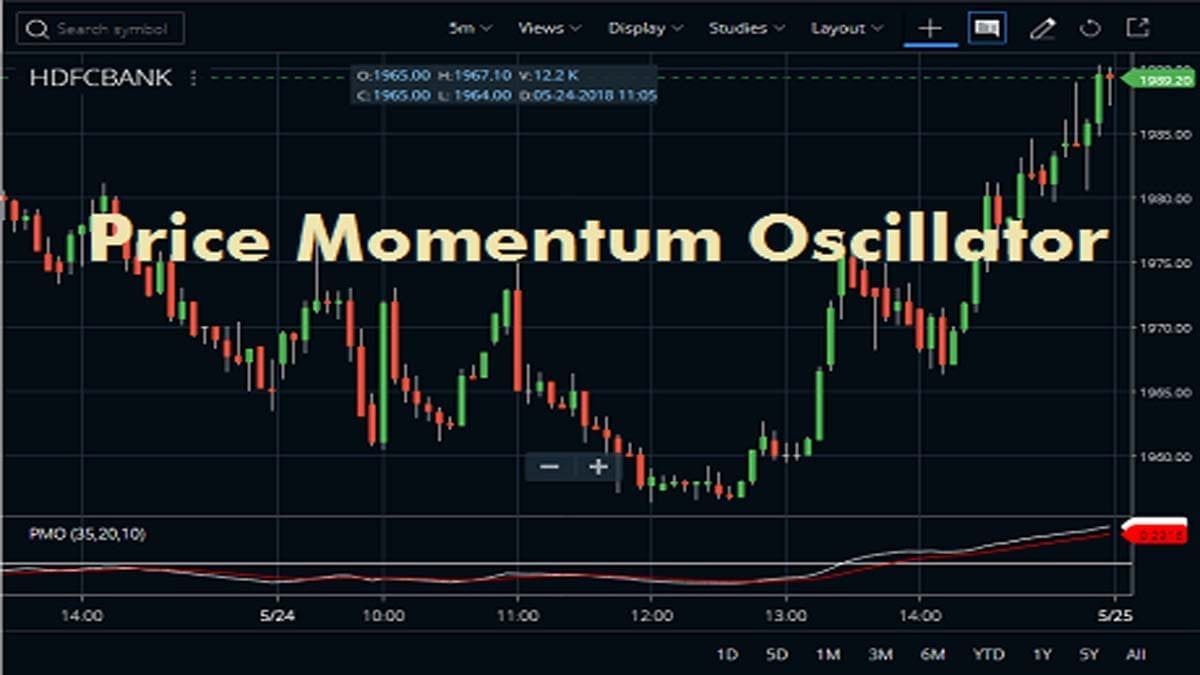
The Price Momentum Oscillator is a smoothed version of ROC (Rate of Change)Β which is developed by Decision Point to track changes in a trend strength. This Decision Point PMO (Price Momentum Oscillator) is an oscillator, based on a ROC (Rate of Change) calculation that is smoothed twice with exponential moving averages that use a custom … Read more

Pivot Points Indicator Trading Strategy, Calculation

Pivot Points Indicator Trading Strategy

Pivot Points Indicator is a predictive or leading indicator. Traders use the price level as a possible support and resistance between market movements. Simply, it itself is the average of high, low, and closing prices from the previous trading day. The whole content is about Pivot Points trading along with its features, setup, strategies, and more. … Read more

Trading the On Balance Volume Indicator (OBV)

On Balance Volume Indicator

The On Balance Volume or OBV is a technical analysis indicator that measures buying and selling pressure. It was developed by Joe Granville. This is introduced in Joe Granville’s 1963 book, Granville’s New Key to Stock Market Profits. It was one of the first indicators to measure positive and negative volume flow. In this article, … Read more

Parabolic SAR Indicator (PSAR) Trading Strategy

Parabolic SAR Indicator

Wilder introduced the Parabolic Time/Price System in his 1978 book, New Concepts in Technical Trading Systems. The trend-following indicator helps traders to identify the uptrend and downtrend. You can make an entry and exit by following the dots of the indicator. Here, in this content, you will get an entire picture of the Parabolic SAR … Read more

Negative Volume Index Indicator Technical Settings

Negative Volume Index

The Negative Volume Index indicator or NVI is a cumulative indicator. It uses the change in volume to decide when the smart money is active. This indicator is first developed by Paul Dysart in the 1930s. The Market Technicians Association selected Dysart for its annual award in 1990. This indicator works under the assumption that … Read more

Moving Average Indicator Formula, Setup, Strategy

Moving Average In Zerodha Kite2

Moving Average Indicator or in short, MA is a widely used indicator in technical analysis. It does not predict the price direction but rather defines the current direction. The indicator lag due to being based on past prices. The indicator’s main importance is it helps smooth price action and filter out noise. The content will … Read more

Money Flow Index Indicator Set Up, Trading Tactics

Money Flow Index In Zerodha Kite2 1

The Money Flow Index indicator is a momentum indicator that measures the flow of money. We can also call the indicator MFI. It is related to the RSI (Relative Strength Index) but incorporates volume, whereas the Relative Strength Index only considers the price. What is Money Flow Index Indicator The Money Flow Index (MFI) is … Read more

Momentum Indicator: Formula & Trading Strategy

Momentum Indicator

The Momentum Indicator is a leading indicator which is measuring a security’s rate of change. This is comparing the current price with the previous price from a number of periods ago. The ongoing plot forms an oscillator that moves above and below 0. It is a fully unbounded oscillator and it has no lower or … Read more

Mass Index Indicator Calculation, Trading Tips

Mass Index Indicator

Mass Index Indicator is developed by Donald Dorsey. It uses the difference between the high and low in a given interval to spot potential price reversals.Β The Mass Index is a volatility indicator that does not have a directional bias. Instead, this indicator identifies range bulges that can foreshadow a reversal of the current trend. What … Read more

How to Trade Market Facilitation Index Indicator?

Market Facilitation Index-Indicator In Zerodha Kite3

Market Facilitation Index Indicator or MFI is used to see the strengths and weaknesses of price movements. This indicator’s absolute values alone cannot provide any trading signals, unlike its dynamics in relation to the dynamics of the volume. In this article, let us discuss the setup guide and usage of this lesser-known technical indicator. What … Read more

Moving Average Convergence Divergence: MACD Indicator

Moving Average Convergence-Divergence In Zerodha Kite2

The MACD indicator (Moving Average Convergence Divergence) is a momentum and trend-following indicator. It is based on the information of moving averages. It is developed by Gerald Appel in the late seventies. The MACD oscillator is one of the simplest and most effective momentum indicators available. The Moving Average Convergence/Divergence (MACD) indicator is a momentum oscillator … Read more

🟣 Zerodha Best Overall 🟒 FYERS Best Charts πŸ”΅ Upstox Beginner Friendly