RAVI Indicator Settings, Calculation, Usage

RAVI Indicator

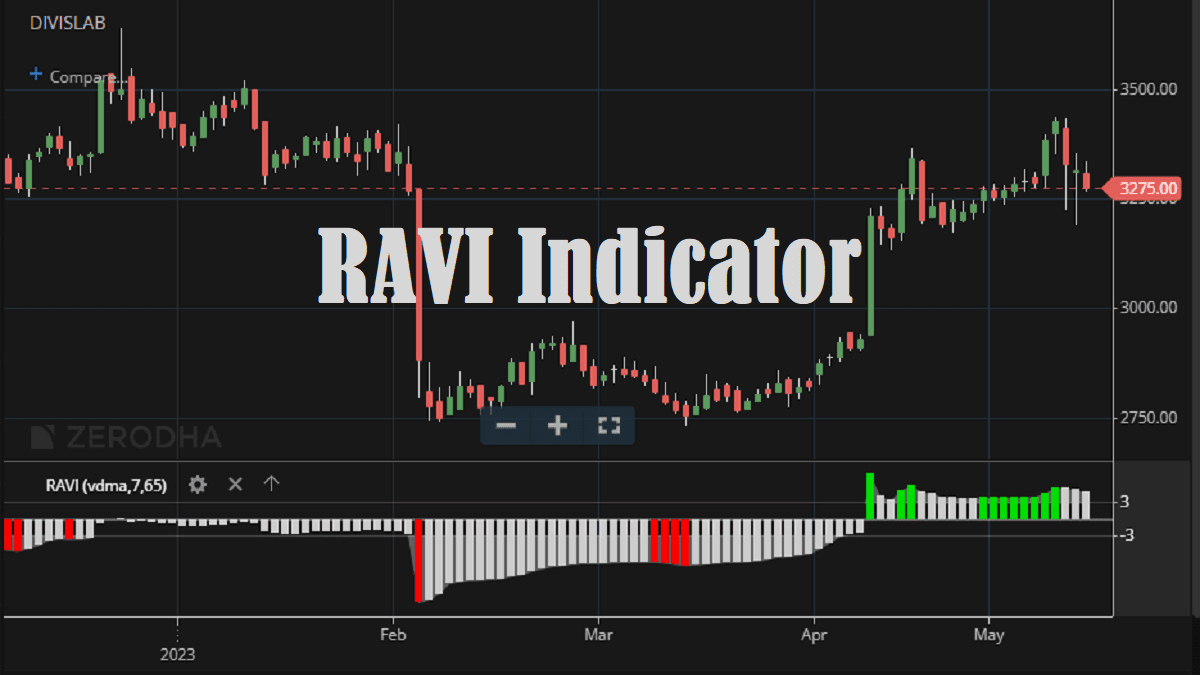
Range Action Verification Index or the RAVI indicator is a forex trading indicator. This is a very simple forex trading tool. This indicator should be used as a signal confirmation indicator rather than a signal generator indicator. Only in a trending market condition, this RAVI works well. Traders might get lots of fake signals and … Read more

QStick Indicator, Formula, and Trading Strategy

QStick Indicator Formula

The Qstick indicator is a momentum indicator that provides a measurement of buying or selling strength in a market. It’s basically a calculation of the difference between the open and close prices. The indicator is designed to indicate net price gains or losses over a specific time period. This type of indicator was designed by … Read more

Psychological Line Indicator Usage, Trading Tips

psychological lines defination

The Psychological Line Indicator (PLI) works like other oscillators. It is based on the assumption that traders will resist paying more for a share than others unless obviously, the share continues to move up. Oppositely, traders resist selling a share for less than the price others have been getting for it, except if the price … Read more

Pring Special K Indicator Settings, Usage, Strategy

Prings Special K

The Pring Special K indicator is a momentum indicator which is created by Martin Pring. This indicator is combining multiple time frames, i.e., short-term, intermediate as well as long-term velocity into 1 complete series. Thus it gives us true summed cyclicality. There areΒ two functions of the Pring Special K indicator- Calculation of Pring Special K … Read more

Pring’s Know Sure Thing Indicator (KST) Strategy

Know Sure Thing

Know Sure Thing Indicator (KST) is a momentum oscillator based on the smoothed rate-of-change for four different time frames. Martin Pring, the author of Complete Guide to Technical Analysis An Indian Perspective, developed the indicator. Pring referred to this indicator as to the “Summed Rate of Change (KST)”. KST measures price momentum for four different … Read more

Overbought and Oversold Meaning (Examples, RSI Guide)

Overbought and oversold meaning illustrated with RSI indicator and stock chart signals

A regular investor must be familiar with the terms Overbought and Oversold, or OB and OS, in the stock market. These are the two significant phases of a market movement. Finding a proper Entry time is considered the most important decision in trading. When the OB or OS situation reaches the extreme point, the reverse … Read more

How to use the Prime Number Oscillator?

Prime Number

The prime number oscillator indicator indicates the nearest prime number, be it at the top or the bottom of the series, and outlines the difference between that prime number and the respective series. Like its band version, this oscillator is also developed by Modulus Financial Engineering Inc. Determining market trends has become a science even … Read more

Prime Number Bands Indicator Features & Usage

Prime Number Bands

Determining market trends has become a science even though a high number of people still believe it’s a gambling game. Mathematicians, technicians, brokers, as well as investors, have worked together in developing quite several indicators to help them better understand and forecast market movements. The Prime Number Bands indicator was developed by Modulus Financial Engineering … Read more

Price Volume Trend Indicator Formula & Strategy

Price Volume Trend

The Price Volume Trend Indicator (PVT) is a technical momentum indicator that relates price and volume. It is utilized by investors and analysts to identify the parity between the supply and demand of a stock. This indicator was invented by Joseph E. Granville. What is the Price Volume Trend Indicator? Traders use both the Price Volume … Read more

Price Rate of Change Indicator Formula & Strategy

Price Rate of Change Technical Indicator

The Price Rate of Change (PROC) or Rate of Change (ROC) indicator is aΒ price-based technical oscillator. It is a pure momentum oscillator that measures the percent change in price from one period to the next. The Rate of Change or ROC indicator mainly reflects the overbought and oversold situation. What is the Rate of Change … Read more

Price Oscillator Indicator (PPO) Trading Tactics

Price Oscillator Indicator pic

TheΒ Price Oscillator Indicator, also known as the Percentage Price Oscillator (PPO) is a technical analysis tool, used for measuring momentum. This indicator mainly suggests the overbought and oversold areas, confirming bullish, bearish price moves. This article contains its calculation method and trading tactics. What is Price Oscillator or Percentage Price Oscillator? The Price Oscillator shows … Read more

🟣 Zerodha Best Overall 🟒 FYERS Best Charts πŸ”΅ Upstox Beginner Friendly