How to Trade the Balance of Power Indicator?

Balance of Power Indicator

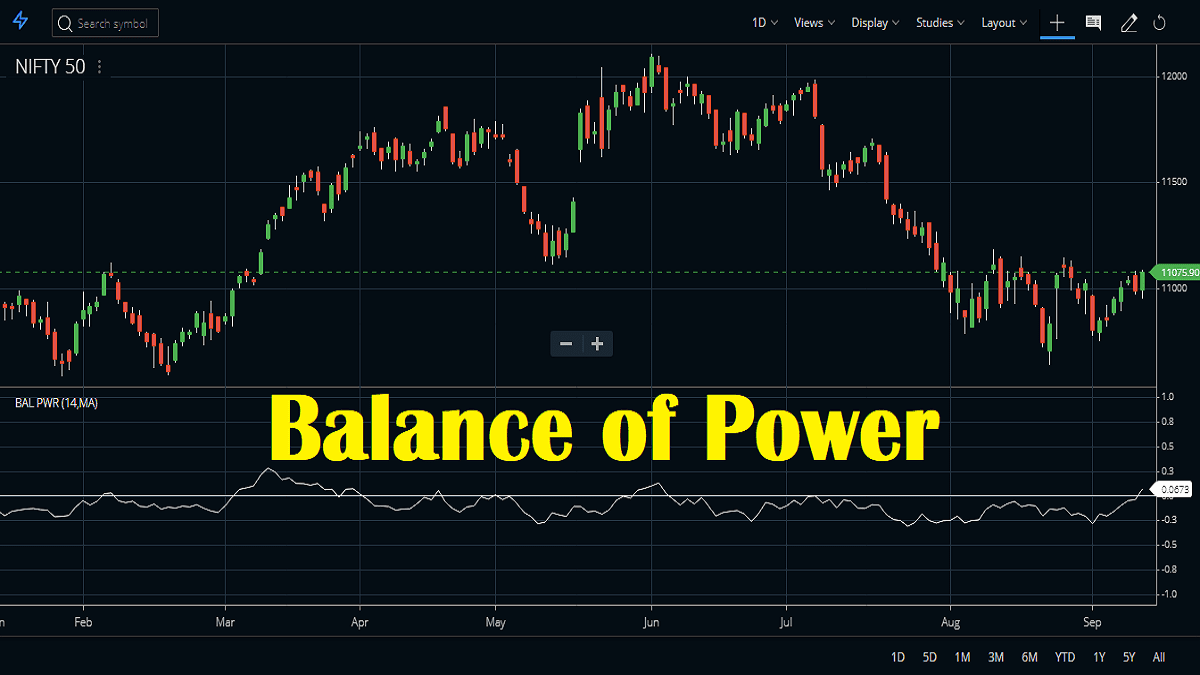
The Balance Of Power indicator or BOP measures the power that the buyers and sellers have. It’s a very volatile indicator. It goes up and down very often. It also determines market strength by assessingย the strength of total buyers against that of total sellers and their ability to drive the price to extreme ends. More … Read more

Awesome Oscillator Indicator: The Ultimate Guide

Awesome Oscillator

Awesome Oscillator indicator (AO), is an oscillator that helps traders to understand the market momentum. This can calculate the momentum in any time frame. This indicator has been designed by Bill Williams of the Profitunity Trading Group. Now, why is the indicator called awesome? What is so special about it? Awesome Oscillator Indicator FAQ How … Read more

Average True Range (ATR) Indicator: Formula, Settings & Strategy

Average True Range (ATR) indicator rising during volatility expansion on a candlestick chart

Introduction If you have been trading stocks, indices like Nifty or Bank Nifty, or even commodities, you will often notice that sometimes the market moves very slowly and sometimes it becomes extremely volatile. Understanding this volatility is extremely important for traders because volatility determines how far the price can move within a certain period. One … Read more

Aroon Oscillator Formula and Trading Strategy

Aroon Oscillator

Aroon oscillator (ARO) was also developed by Tushar Chande. It actually an oscillator version of the same named Aroon indicator. The name is taken from Sanskrit. In Sanskrit, the Aroon means morning dawn. Like the indicator, the oscillator too identifies a trend and determines how strong the trend is. It also identifies a probable trend … Read more

Aroon Indicator Formula, Strategy, Best Setting

Aroon Indicator

The Aroon indicator was developed by Tushar Chande to determine the price trend of a stock and also to understand how strong is the trend of the stock price. There are two lines in the indicator. The green line shows an uptrend and the red line shows a downtrend. The green line is known as … Read more

Alligator Indicator Trading Strategy, Formula, PDF

Alligator-Indicator

Alligator indicator trading strategy is used by traders to gauge the long and short-term trends of the market/ stock over a specific period of time. This indicator identifies the trend change by using its three constituent components. In this post, I shall discuss the formula or calculation, and trading strategy using this indicator. I will … Read more

Trading the Accumulative Swing Index Indicator

Accumulative Swing Index

Accumulative Swing Index indicator or also known as ASI is used by traders to gauge the long and short-term trends of the price of a stock over a specific period of time. The ASI indicator tends to project real market conditions, the indicatorย resembles the true price helping the trader to understand the real market scenario. … Read more

Guide to the Accumulation Distribution Indicator

Accumulationdistribution

The Accumulation Distribution indicator is a leading indicator that uses the relationship between the stock’s price and volume within a specific period of time. When traders buy a stock or accumulate it backed by big volume we assume that in the future price may go up. Similarly, when traders sell a stock or distribute it … Read more

ATR Trailing Stops Formula and Trading Strategy

Atr trailing stops

Average True Range indicator or ATR is an indicator that shows the historical volatility of a stock’s price over a specific period of time. ATR shows the historical range of price movement over a specific time period. ATRย Trailing Stops is an extension of ATR where the basicย idea of ATR has been used to create trailing … Read more

Axis Direct Pick Of The Week – Federal Bank

Axis direct pick of the week

Introduction Every Monday, Axis Direct comes up with weekly recommendations known as Axis Direct Pick of the Week. These recommendations are backed up by in-depth research from Axis Direct, making them very reliable. Axis Direct Pick of the Week: Federal Bank For this week, Axis Direct picked Federal Bank based on fundamental analysis. Let’s take … Read more

ATR Bands Indicator Calculation, Settings

ATR Bands

The average true range, popularly known as ATR, gives the historical price range of a stock or the volatility of a stock plotted in a time frame (14 by default but can be changed). It gives the average range of the price of the stock. But ATR does not show the price trend. To overcome … Read more

๐ŸŸฃ Zerodha Best Overall ๐ŸŸข FYERS Best Charts ๐Ÿ”ต Upstox Beginner Friendly