
Introduction
If you’ve been scanning fundamentals on Screener/your broker app and saw return on net worth (RONW), you’re not alone if you felt confused—because the term sounds like personal finance, but in Indian stock-market language, it’s usually a straight-up profitability ratio for companies. And when you’re a retail trader or investor trying to build a practical, repeatable process, confusion kills speed and confidence. You either ignore the metric completely, or you over-trust a single number and end up buying a “great RONW” story that collapses when the cycle turns.
I’ve been trading and analysing Indian stocks since 2002, and one pattern repeats: beginners want a clean answer (“Is this good or bad?”), while intermediate investors want a framework (“How do I use this with ROCE, debt, cash flow, and valuation?”). RONW sits right in that sweet spot—simple enough to calculate, powerful enough to shortlist quality businesses, and dangerous enough to mislead you when leverage or buybacks distort the picture.
In this guide, I’ll break RONW down the way I’d explain it to a serious retail investor building a data-driven system using TradingView, spreadsheets, and screeners: clear meaning, the correct formula, how to interpret ranges, and how to combine it with ROCE/ROA and debt checks so you’re not fooled by a “pretty ratio.” You’ll also get a practical screening checklist and a calculator tool you can embed or use for quick analysis.
1) What Return on Net Worth (RONW) Really Means in the Stock Market
Direct answer: In the Indian stock market, RONW is most commonly used as the same concept as ROE—how efficiently a company generates profit from shareholders’ equity (net worth).
RONW in plain language (without jargon)
Think of net worth as the shareholders’ “capital base” inside the business (equity share capital + reserves, broadly). RONW asks one question: For every ₹100 of shareholders’ money sitting in the company, how many rupees of profit did management generate this year? That’s why you’ll see it repeatedly in IPO discussions, broker glossaries, and fundamental screens.
Here’s the real-world investing reason it matters: when I’m shortlisting stocks for swing trades or long-term investing, I’m looking for businesses that don’t need constant fresh equity to grow. Consistently strong RONW often signals either (1) pricing power, (2) operational efficiency, or (3) an asset-light model—or sometimes just leverage (which is why we verify it later).
A quick story from the “ratio trap” zone
A few years back, I reviewed a midcap with eye-catching RONW on a screener. The chart looked great, margins looked decent—and yet cash flows were weak, and receivables were stretching. On paper, RONW said, “efficient.” In practice, the working-capital cycle was doing the damage. The takeaway: RONW is a starting filter, not a final decision metric.
Practical takeaway: Treat RONW as a “business efficiency signal” that helps you shortlist, but always plan a second-level check (ROCE, debt, cash flow quality) before committing capital.
2) Return on Net Worth Formula (and the Only Version You Should Use for Stocks)
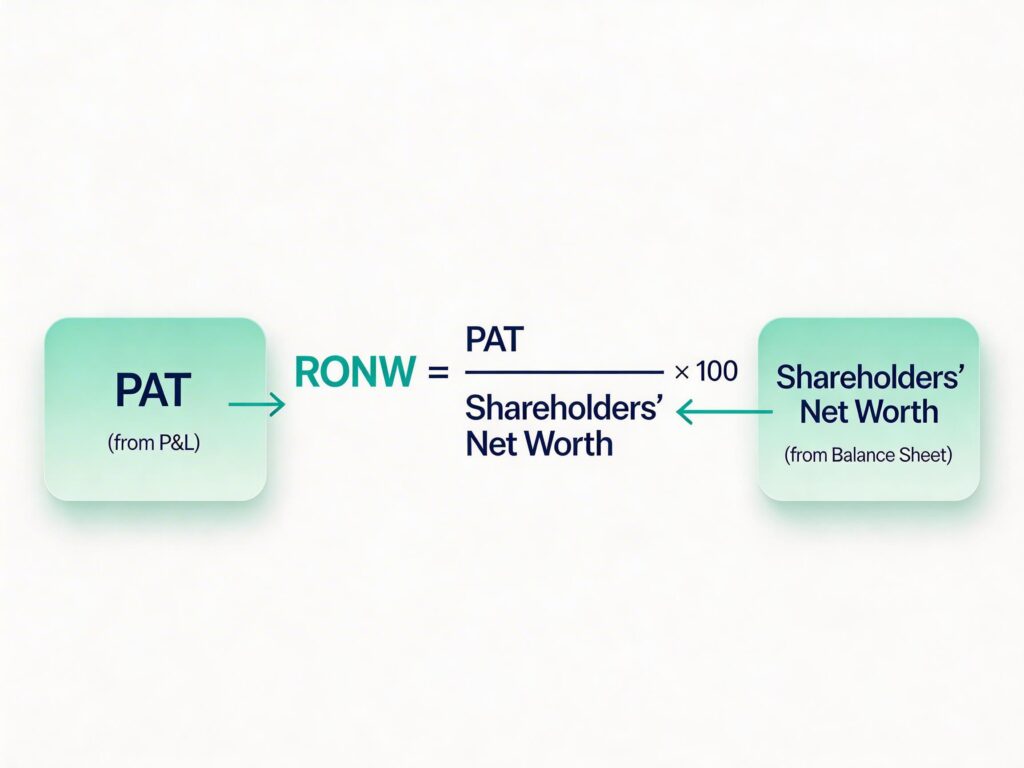
Direct answer: The standard corporate return on net worth formula is:
RONW = (Profit After Tax ÷ Shareholders’ Net Worth) × 100.
The formula breakdown (so you don’t plug the wrong numbers)
In most Indian contexts, you’ll see:
- PAT (Profit After Tax) from the P&L
- Net Worth / Shareholders’ Equity from the balance sheet (equity share capital + reserves, broadly)
Many platforms use closing net worth; a more refined method uses average net worth (opening + closing ÷ 2), especially when equity changes significantly during the year. That’s useful when you’re comparing across years or analysing companies with buybacks/dilution.
A simple worked example (Indian-style)
Suppose a company reports:
- PAT = ₹120 crore
- Net worth = ₹600 crore
RONW = 120 / 600 × 100 = 20%
Interpretation: management generated ₹20 profit for every ₹100 of shareholders’ funds. That’s strong if it’s sustainable and not purely leverage-driven.
Practical takeaway: Use PAT and shareholders’ net worth (equity). If equity changes sharply, use average net worth to avoid misleading jumps.
3) What’s a “Good” RONW in India? (And Why One-Number Benchmarks Mislead)
Direct answer: A “good” RONW is typically higher than peers and stable over years, but the right benchmark changes by sector, business model, and leverage.


The practical range approach (how I use it)
Retail content often throws rules like “15% is good, below 10% is poor.” That’s not useless—but it’s incomplete. A capital-light consumer/IT business can sustain higher RONW than a heavy-asset utility-like business. Banks/NBFCs have their own context because balance sheets work differently, and leverage is structurally part of the model.
Here’s a trader-friendly way to interpret without overcomplicating:
- First: Compare within the same sector
- Second: Check 5–10 year consistency, not just one year
- Third: Confirm the story with ROCE + debt + cash flow
I personally prefer consistency over spikes. A business that holds decent RONW through rough years often has stronger resilience than a business that posts one “fantastic” year and then fades.
A quick example: “Same RONW, different quality”
Company A: RONW 22% with low debt and steady cash flows.
Company B: RONW 22% but debt rising, interest coverage thinning.
On a screener, they look equal. In reality, Company B is more fragile—one margin hit and equity returns fall fast. This is exactly why I pair RONW with ROCE and debt metrics in my Sheets-based checklists.
| Sector Type | Typical RONW Behavior | What to Verify | Common Trap ⚠️ |
|---|---|---|---|
| IT & Asset-Light Businesses | High and stable (15%–30%+) | Consistency, margin stability, client concentration | High RONW looks great, but can hide slowing growth |
| FMCG & Consumer | Moderate to high, steady over years | Brand strength, pricing power, cash flow quality | Paying too high valuation just for “consistent RONW” |
| Banks & NBFCs | Moderate (12%–20%), varies with credit cycle | Asset quality (NPAs), credit growth, capital adequacy | Ignoring rising bad loans behind decent RONW |
| Manufacturing / Cyclical | Volatile; peaks in upcycles | Cycle timing, capacity utilization, operating leverage | Chasing peak-cycle RONW before downturn |
| Capital-Intensive (Infra, Power) | Low to moderate (8%–15%) | Debt levels, interest coverage, project execution | Low RONW may still be acceptable due to heavy assets |
| Turnaround / Distressed | Erratic or negative | Debt reduction, cash flow recovery, margin improvement | One good year ≠ sustainable improvement |
Practical takeaway: Don’t chase the highest RONW. Chase repeatable RONW supported by clean balance sheet + cash flow quality.
4) RONW vs ROE vs ROCE (and the Leverage Reality)
Direct answer: RONW and ROE are usually the same in stock-market usage; ROCE is broader because it evaluates returns on total capital employed (equity + debt), making it harder for leverage to “paint a pretty picture.”
The clean mental model
- RONW/ROE: return generated on shareholders’ funds
- ROCE: return generated on total capital used in the business
- ROA: return generated on total assets
If a company uses debt smartly, RONW can rise. If it uses debt badly, RONW can look fine until the cycle turns. This is why ROCE is a strong “truth filter” when you suspect leverage is doing the heavy lifting.
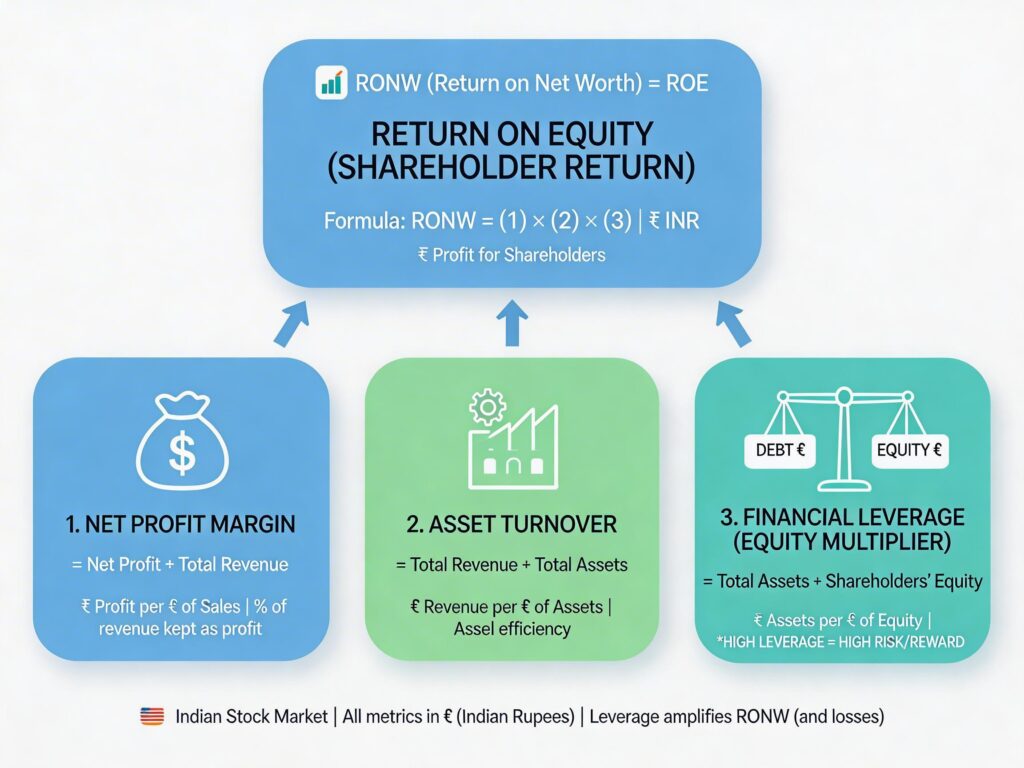
The DuPont-style “why is RONW high?” lens
When you want to go beyond definitions, the fastest practical upgrade is to break ROE/RONW into drivers (margin, asset efficiency, leverage). If you want the classic DuPont breakdown, this explainer is a useful reference: DuPont analysis guide.
Now bring it back to the Indian retail workflow: you don’t need a PhD model. You just need to ask:
- Is RONW high because net margin is strong?
- Or because asset turns are strong (efficient asset use)?
- Or because the company is simply running a higher equity multiplier (leverage)?
That single question changes how you size risk.
Practical takeaway: Use RONW to shortlist quality, then use ROCE and leverage checks to confirm the returns are operational—not just financial engineering.
5) How to Use RONW for Stock & IPO Screening (A Retail-Friendly Checklist)
Direct answer: Use RONW as a first-pass filter, but confirm it with growth, debt, and cash-flow quality—especially for IPOs where headline ratios can look impressive but sustainability is the real question.
The “5 checks” framework I recommend
When readers of StockManiacs ask me how to systematise fundamentals, I suggest turning ratios into a checklist you can run every time:
- RONW consistency: look at multi-year stability (avoid one-year spikes)
- Compare with ROCE: if RONW is high but ROCE is mediocre, leverage may be boosting equity returns
- Debt sanity: debt-to-equity + interest coverage trend
- Cash flow alignment: profits should convert to cash over cycles
- Valuation reality: pair RONW with P/B and P/E context (high-quality often trades expensive—your entry needs discipline)
This aligns with how retail investors naturally discuss it—RONW plus growth, debt, and cash flow—not RONW alone.
A quick IPO-style example (how to think, not what to buy)
In IPO conversations, you’ll see numbers like “RoNW 25%” or even “RoNW 50%+” being used as proof of quality. That’s a strong signal—but you still need to ask: Is it driven by sustainable margins, or temporary cycle tailwinds? Is working capital expanding? Is the net worth small due to buybacks or the recovery of accumulated losses? IPO docs often highlight RONW prominently, which is why retail investors obsess over it.
Practical takeaway: For screening, RONW is your “quality gate.” For decisions, RONW must pass the “ROCE + debt + cash flow” confirmation.
6) The Hidden Traps: Negative Net Worth, Buybacks, and “Too Good to Be True” RONW
Direct answer: RONW can mislead when net worth is distorted (very low/negative), when buybacks shrink equity, or when profits include one-off gains—so you must sanity-check the denominator and the earnings quality.
Trap #1: When net worth is tiny (or negative)
If net worth becomes very small, even moderate profits can produce an explosive RONW percentage. If net worth is negative, the ratio can become meaningless or flip signs in ways that don’t reflect operating reality. In these cases, your focus shifts to operational metrics (ROCE, margins, cash flow trends) until equity normalises.
Trap #2: Buybacks can “improve” RONW mechanically
Buybacks reduce equity. That can lift RONW even if the business didn’t improve. Buybacks are not bad by default—but they change the math. Whenever you see a rising RONW, check whether equity has been shrinking. If yes, verify whether EPS growth and cash flows justify it.
Trap #3: One-off profits (the silent killer for ratio-based buying)
A company sells land, books exceptional income, and suddenly RONW looks “amazing.” Next year it normalises, and the stock rerates lower rate. This is why I keep a simple rule in my spreadsheet models: if RONW jumps sharply, I look for what changed in PAT and whether it’s repeatable.
Pair RONW with balance-sheet valuation using Price to Book Value Ratio, especially when screening “high RONW” stocks that trade at rich P/B.
Practical takeaway: When RONW looks unusually high, don’t get excited—get forensic: check equity movement, exceptional income, debt trend, and cash conversion.
Conclusion
Return on net worth is one of those metrics that feels “too simple” at first—until you realize it can either sharpen your stock selection or sabotage it, depending on how you use it. In Indian market usage, RONW is typically the same practical concept as ROE: profit generated from shareholders’ funds. The formula is straightforward (PAT ÷ net worth), but interpretation is where investors either level up—or get trapped by leverage, buybacks, or one-off profits.
If you take only one action after reading this, make it this: shift from single-year RONW to multi-year RONW + confirmation metrics. In my own workflow (TradingView for trend context, screeners for filters, Google Sheets for repeatable checklists), I treat RONW as a quality filter and ROCE/debt/cash flow as the lie detector. That combination keeps you practical, disciplined, and less emotional when the market narratives get loud.
Next steps you can take today:
- Add RONW to your screening checklist, but make it multi-year
- Compare RONW with ROCE vs ROE to understand leverage impact
- If you’re building a fundamentals-first watchlist, also consider combining this with quality filters like the Piotroski F-Score to avoid “great ratios, weak quality” setups.
Once you do this a few times, RONW stops being a confusing glossary term—and becomes a clean, repeatable decision tool you can trust.
StockManiacs Quick Tool Return on Net Worth (RONW) Calculator
Return on Net Worth (RONW) Calculator
Compute RONW using closing or average net worth + analyze multi-year data.
FAQs on Return on Net Worth (RONW)
Return on Net Worth (RONW) is a profitability measure that shows how efficiently a company generates profit from shareholders’ funds. In simple terms, it tells you how much profit is earned for every rupee of equity invested.
RONW is calculated using the formula:
RONW = Net Profit After Tax ÷ Shareholders’ Net Worth × 100
Some analysts also use the average net worth for better accuracy over a period.
Yes, in most cases, RONW (Return on Net Worth) and ROE (Return on Equity) are used interchangeably. Both measure returns generated on shareholders’ equity.
A RONW above 15% is generally considered good for most companies, while consistent performance over multiple years is more important than a single high number. However, the ideal level varies by industry.
RONW helps investors evaluate management efficiency, compare companies within the same sector, and identify businesses that consistently generate strong returns on equity capital.
")

