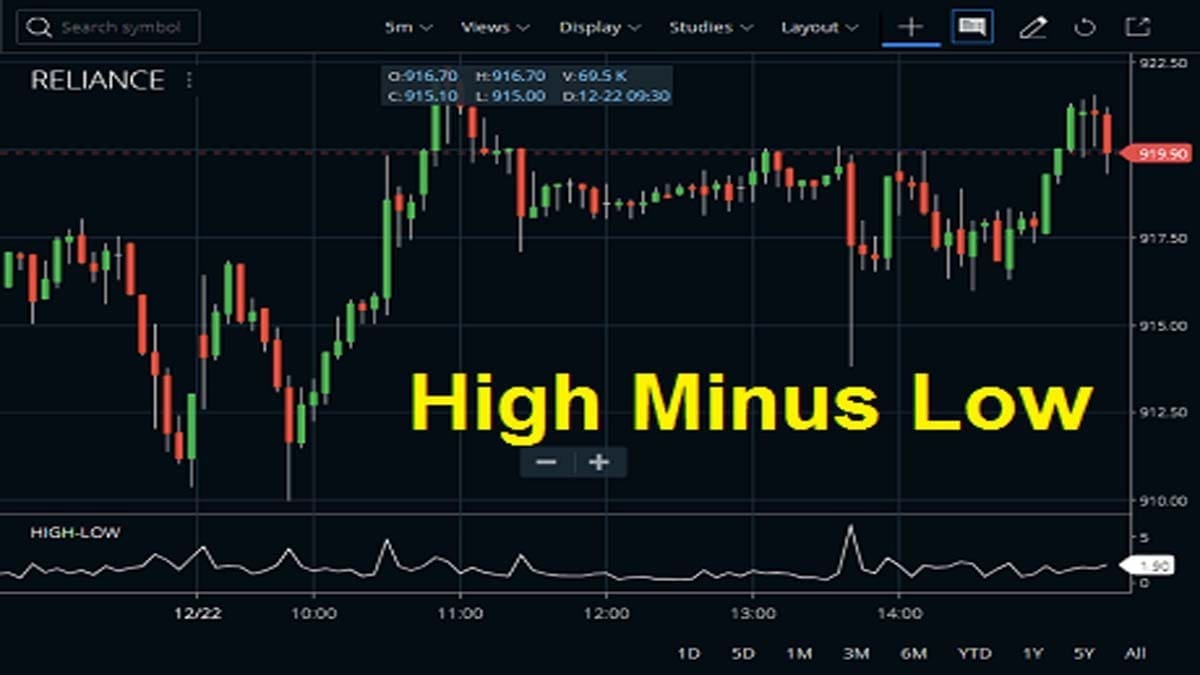
High Minus Low indicator (HML) can help an investor or trader to identify the range of security or stock. It actually plots the difference between the stock’s high of the day and low of the day and plots the range of the day. it looks like a zigzag line with sudden spikes. Those sudden spikes represent all those high-range days when the difference between the high of the day and the low of the day is huge. Zerodha Kite has added it in their STUDIES section in the charts.
What is High Minus Low?
As the name suggests high minus low is simply the day’s low subtracted from the day’s high. So it is a volatility indicator like the average true range. The bigger the difference between the high and low the bigger the spike in the indicator. When volatility rises the difference between the high and low also rises. So we observe a spike in the HML indicator on big bar days.

How To Attach The High Minus Low Indicator In Zerodha Kite?
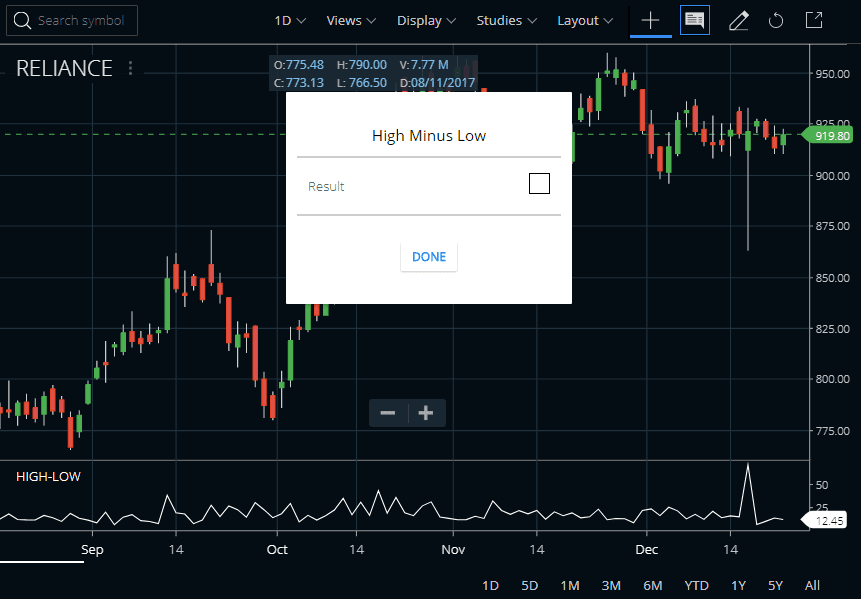
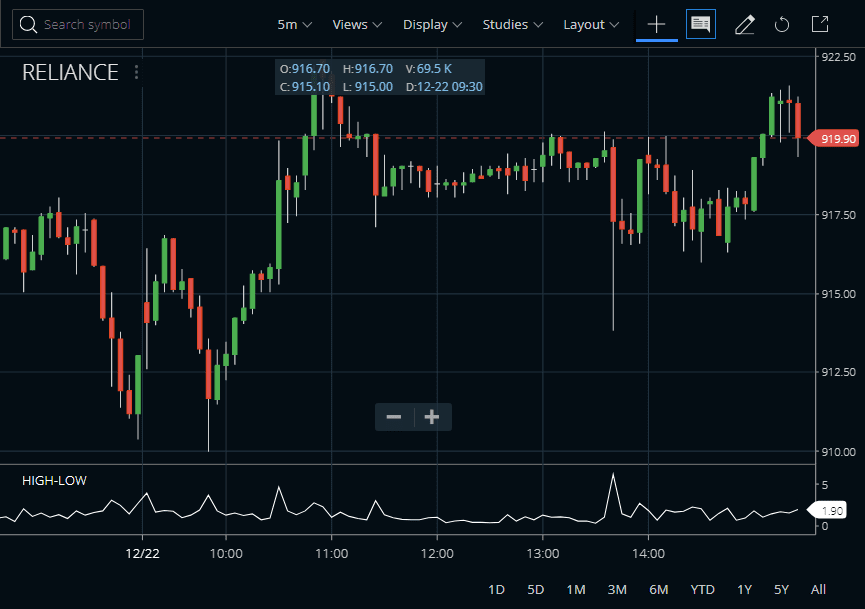
First, open a chart in Zerodha Kite and go to the STUDIES section. In the drop-down select “HIGH-LOW” and it can be added to the chart with default settings. See the image below where I have added this technical indicator to Reliance Industries share price daily chart.






Use of HML in Fama and French’s Three-Factor Model
Investopedia says it is used to evaluate profit margins for a stock over the short-term and long-term. The High Minus Low Indicator provides an indication of the anticipated performance of the security in the future. The formula of high minus low is used to calculate the associated range. This is one of the three factors in the original Fama and French’s Three-Factor model. This model builds off of the one-factor model associated with the Capital Asset Pricing Model (CAPM), with a factor referred to as beta, by adding the factors of size, also referred to as small minus big (SMB), and value as defined by HML.
Use of the High Minus Low indicator in trading
The High Minus Low indicator is very helpful for traders to judge the volatility of a scrip. A low value of HML denotes range-bound price movement while a sudden spike in the indicator denotes range expansion in the scrip. This indicator is best to use on higher timeframes like daily, weekly, or monthly.
Using High Minus Low indicator with Volume
The HML is especially useful when we use the same with volume. Using it with volume can give an idea of the range expansion. It also gives an idea of whether the price will take a directional approach or not. The spike in HML along with the consistent rise in volume indicates a directional move. While a spike in HML with a single spike in the volume indicates a high or low trend.
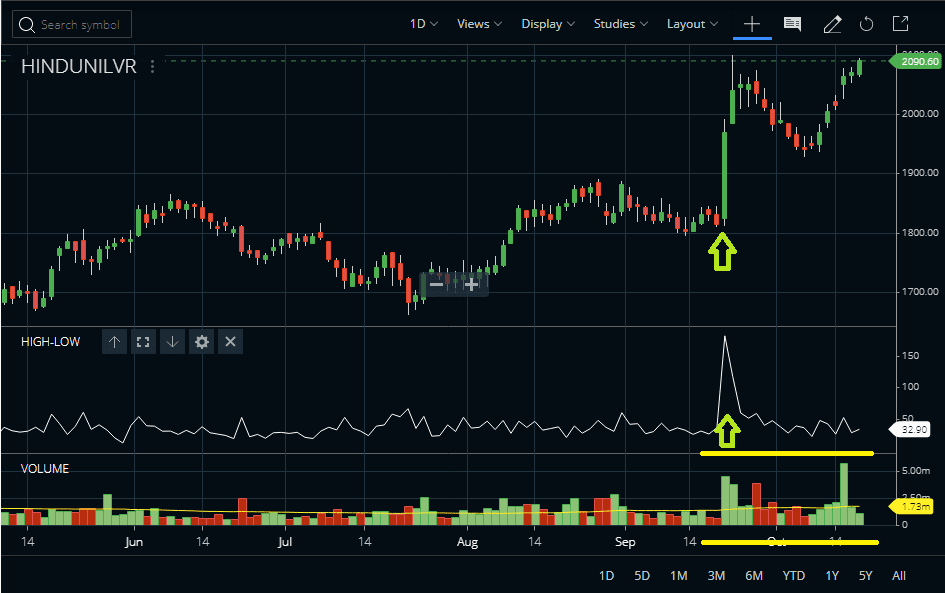
Check the image above, the spike in the High Minus Low indicator with a consistent rise in volume triggers a directional move.
Conclusion
The High Minus Low indicator plots the difference between the high and low of the price. It is a volatility indicator. A high value of HML denotes a trending market while a low value of HML denotes a rangebound market. Using an HML indicator with volume can generate directional trading signals.