We have rewritten this post from our archive of 2017. The topic is still very much important for Indian traders. The National Stock Exchange (NSE) provides daily data after market hours. These data are available in different formats. We also get live data on the options chain of indices and stocks. Through proper data analysis, there are ways for predicting the support resistance of stocks or indices using NSE options data.
How to Find NSE Options Data?
Before we proceed further it is highly necessary to understand how to find NSE options data. For that, we go to the NSE site, then go to live market, select equity derivatives from the drop-down menu at the top, and write down the name of the stock or indices on the box. when the desired page opens, select the options chain for the selected stock or index. A page appears where we can find Open Interest data at different strike prices of stock or indices. Apart from the NSE website, you will get the options chain data from a few broker’s websites.
Example of Checking Nifty’s Options Data
For example, if we select the options chain for Nifty we can go to the following Nifty’s options chain.
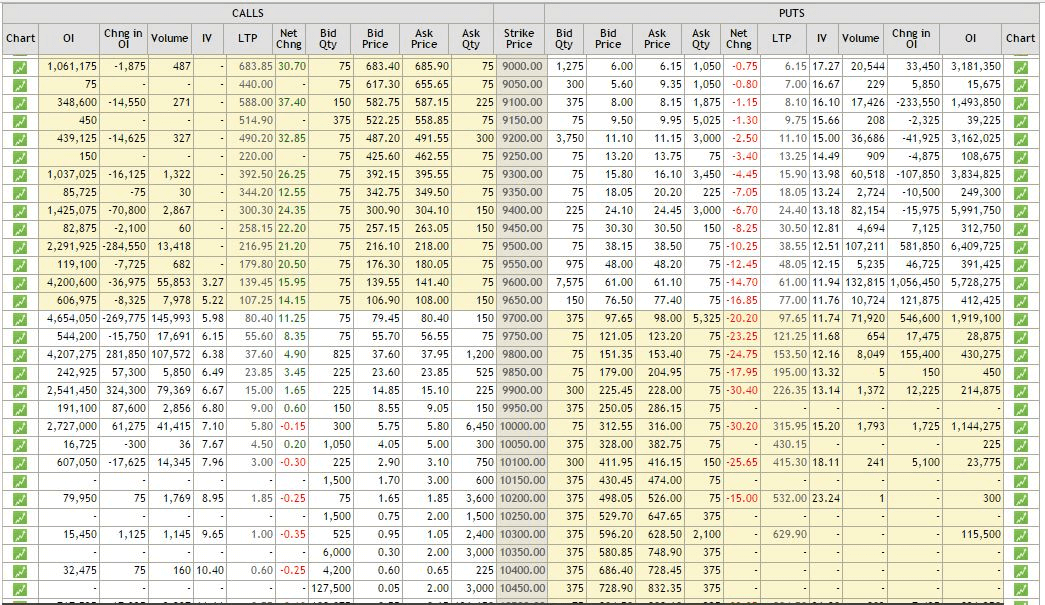
When we go to the page the page looks as follows.






Reading Different Columns in the Options Chain
Now, after close watch, we find there are different columns for Calls and Puts. Strike prices which are of yellow colour are in-the-money strikes (ITM) and the rest of the strike prices which have white backgrounds are out-of-money (OTM) strikes. According to this picture Calls of strike price 9650 and lower are all ITM strike prices. On the other hand strike prices of 9700 Put and above are all ITM Puts. The middle column shows the strike prices.
Reading the Open Interest
Though this table shows bid-ask and LTP (last traded price) of Calls and Puts at different strike prices and data of implied volatility (IV), Open Interest is the main focus in the table. OI (Open Interest) data shows statistics of outstanding OI, the latest change in OI, and OI volume of Calls and Puts at different strike prices.
Open interest basically applies to future and options contracts. We can not apply OI to equity. Open interest can be defined as the number of outstanding contracts at any point in time in the market.
Predicting Support and Resistance with NSE Options Data
Predicting the support resistance of a stock/ index using nse options data is a popular method. The highest concentration of open interest at a particular strike price often denotes the immediate support resistance zone. A shift of position can also be found through the change of OI data. In the table shown above we can see the change in OI data where Call OI data has decreased in all strike prices from 9500, 9550, 9600, 9650, 9700, and 9750 and the 9800 call strike has added a lot of OI positions.
This clearly shows major market participant diluted their positions from other Call positions and concentrated at 9800 calls indicating 9800 as the immediate resistance zone and unless there is a change in the pattern, this may hold true. On the other hand, 9600 Put has added maximum OI and has the second highest outstanding OI position indicating immediate major support for Nifty. Thus we can use the options chain for predicting support resistance or demand-supply levels using nse data for OI.
FAQ
The National Stock Exchange of India (NSE) provides real-time option data which you can access through its website. Alternatively, brokers also offer live streaming options prices from NSE on their trading platforms.
You can view the basic information about any strike price by going to the “Quotes” tab and selecting an underlying security. This will display Put & Call bids/asks along with other details like open interest and volume traded for selected strikes.
Most brokerage websites such as Zerodha or Upstox provide a comprehensive range of analytical tools for analyzing option chains including implied volatility (IV), P&L diagrams, Greeks analysis etc. Tradingview’s platform also offers many advanced features to analyze your trades in multiple market conditions across exchanges worldwide.
You can use the bulk downloads feature on the NSE website to download detailed options data in a CSV file. This includes all strikes and underlying securities for active month series, top traded contracts and open interest summaries across expiries.
Conclusion
In conclusion, we can use the NSE options data and especially the Open Interest in many ways for guessing market sentiment or stock movement in the near future. Live open interest data with the change of OI can be found on our Nifty Open Interest page. We can predict the support or resistance of a stock or index using this data.