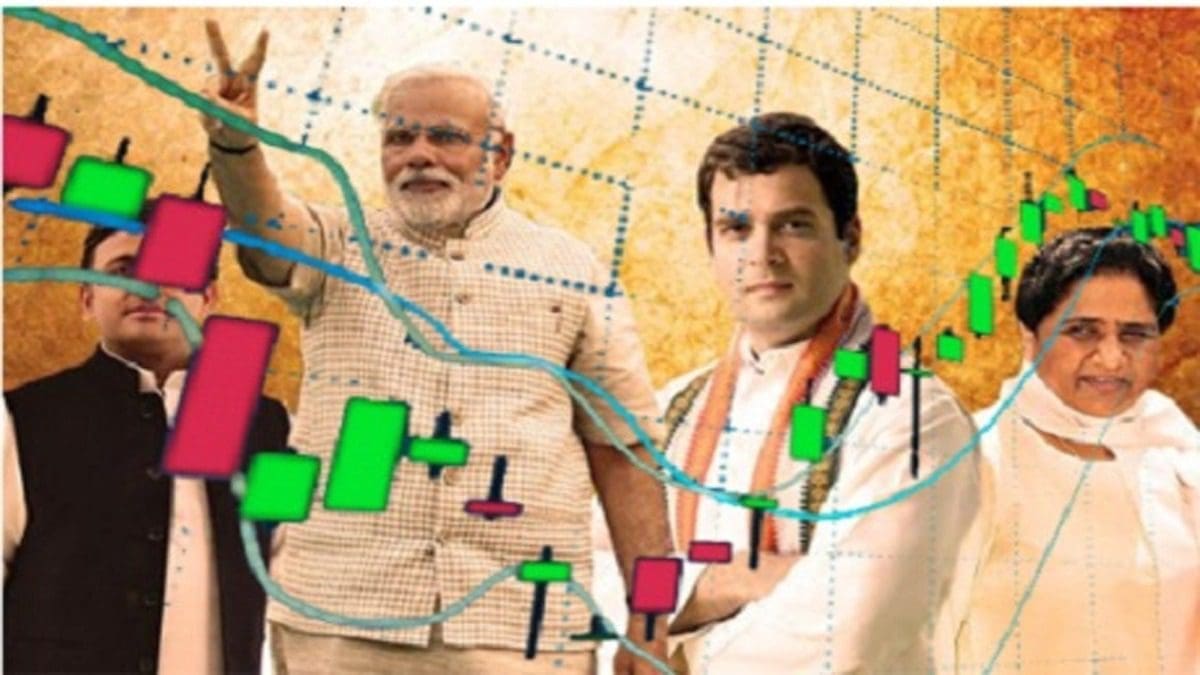
So the Loksabha election result of India for the year 2019 will be declared next week. We all know that the results will be out on 23rd May. The last phase of the election is going to be held tomorrow, i.e., 19th May and the exit polls will be out on Sunday, i.e., 20th May. So let me check the historical data of the Indian stock market during election years.
Why the Election Results are Crucial for the Indian Stock Market?
We all want to make smart investments in the Indian stock market, don’t we? With elections around the corner, it’s important for everyone to analyze the current trends and understand how this could affect their returns. Analyzing the stock market during election years is essential as political events often influence stock movements and thus your investments. This helps you avoid potential pitfalls while opening up potential investment opportunities which may bring positive returns in the long term. Get informed now and reap benefits later!
We all know that we have entered the result week. Last Thursday was the weekly expiry of the Nifty and Bank Nifty indices. and next Thursday is the next weekly expiry as well as the election result. Let us check how historically the stock market has performed in the result week. So let us go into the flashback.
How Did the Indian Stock Market Behave During Election Years?
Now let us check the year-wise scenario of the Indian Stock Market during the Election Years.
1999
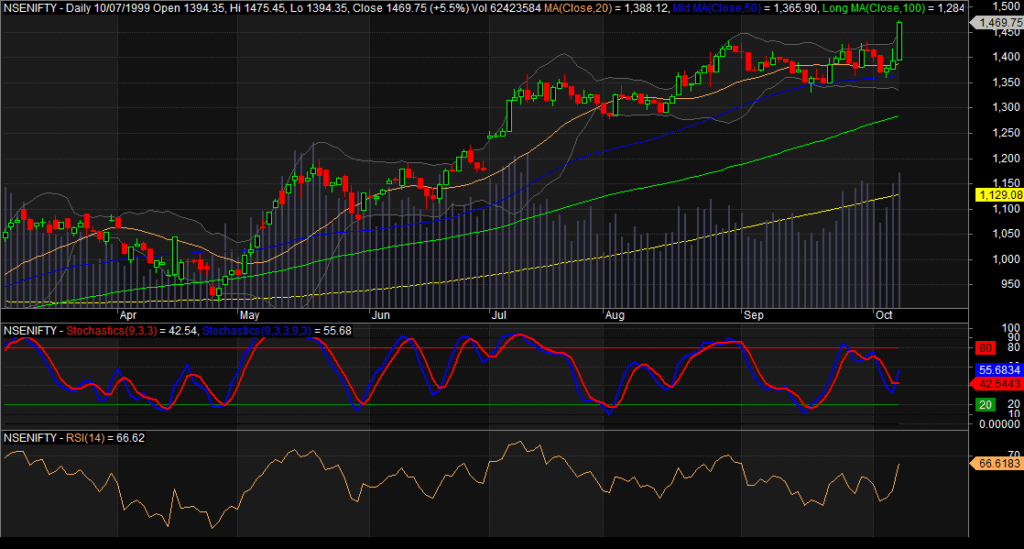
In 1999 we got the coalition government of Shri Atal Bihari Vajpayee. In 1999 on the result week the market has a range of 1432-1359 before the results came. So that is a range of 5.4%. But the total return received from the market was negligible, just -0.1%.
Now let us check the overall stock market performance before the election result in 1999. Check the Nifty daily chart below for 1999.






2004
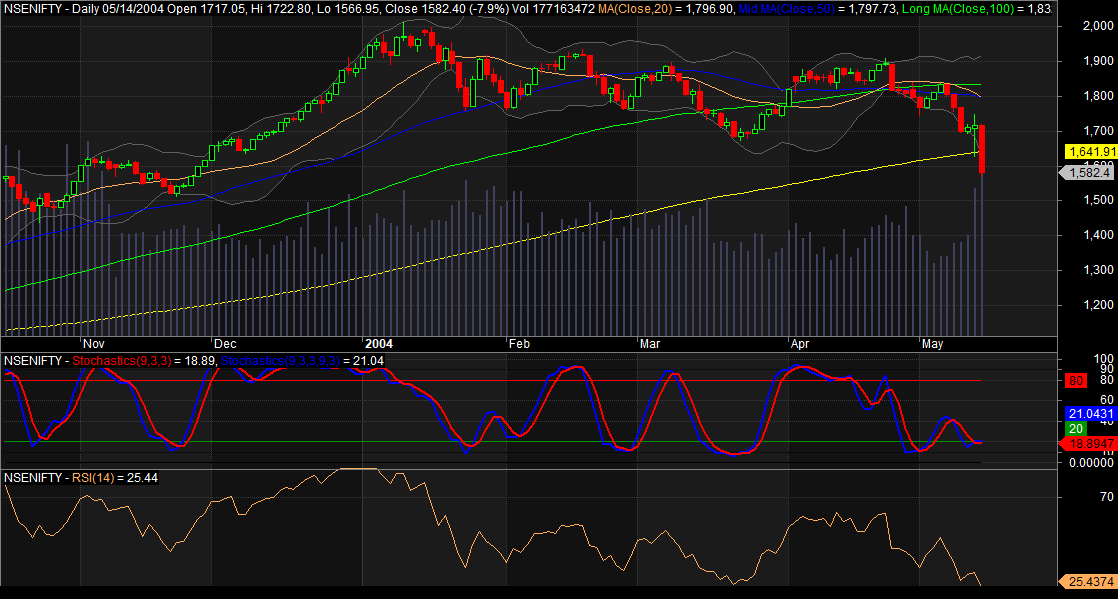
This year we had big talks on India Shining. It was predicted that Shri Vajpayee will not lose. Just the last week before the result has shown a range of 1838-1690. That means a range of 8.8%. The return obtained after this swing was -5.5%. So this year we got a bigger swing as well as a negative but much bigger return. This year UPA formed the government and Dr. Manmohan Singh was elected as the Prime Minister.
Let us now check how the markets performed overall that year before the results.
2009
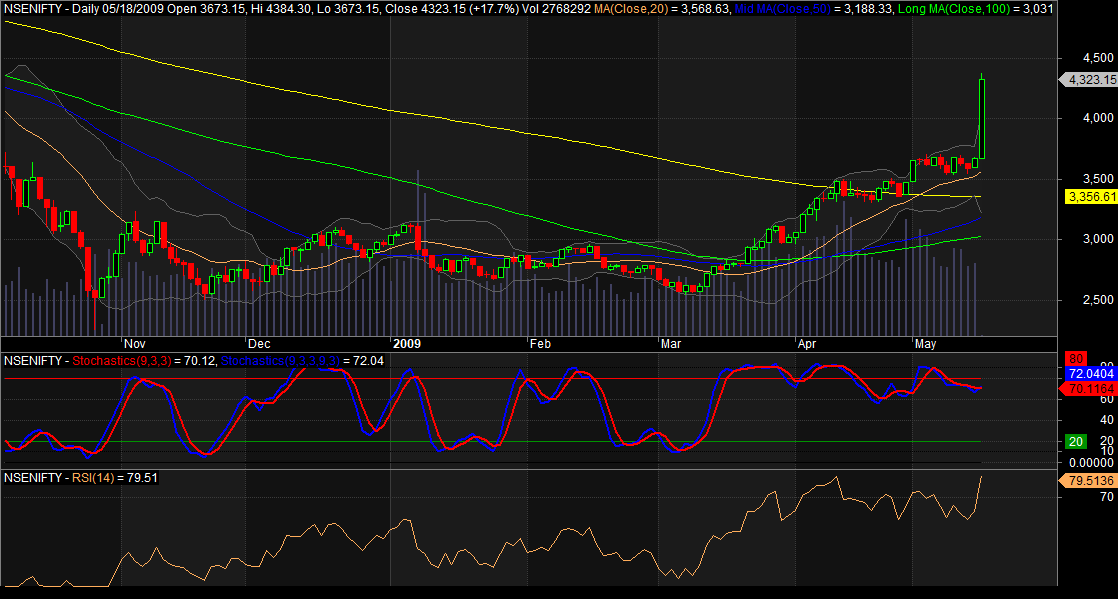
In 2009 the week just before the election result the market was rangebound between 3711-3534. That means it was a swing of 5%. And the previous week before the result yielded a return of -2.5%. Here we are also seeing that the market has doubled in the 10 years time span from 1999 to 2009. This year once again UPA formed the Government under the leadership of Dr. Manmohan Singh.
Let us now check the daily charts of the Nifty index to judge the overall performance of the Nifty index till the result.
2014
After that came the year 2014. All last 3 elections formed a coalition government. Either by NDA or by UPA. But in 2014 there was a Modi wave all over the country. The BJP party took part in the election under the leadership of Mr Nadendra Modi and formed a majority government.
In the year 2014, the week before the election result has seen a range of 7172-6639. That means it was a swing of 8% and the total return obtained in the week before the result was 7%.
Now let us check the daily charts of the Nifty index to check how the market performed overall till the result in 2014.

2019
Now let us check the overall Nifty performance this year to date. Check the image below for the daily chart of the Nifty index.

Analysis of the Indian Stock Market for the Election Years
We have seen that in 1999 the market has not shown any significant correction before the election results. The market has sensed stability after the term of caretaker government by Shri Atal Behari Vajpayee. On the other hand the charts of 2004 show no such rally before the election. The market was in correction mode till the result and showed a plunge after the results. This year the so-called invincible Vajpayee government has lost to bring UPA1.

The chart of 2009 shows that the market was confident about the UPA2 government. We saw a powerful rally before the results and there was no significant correction. The market shoots up after the results. A similar situation was in 2014 when the market was too confident about the Modi government. It was a sharp rally without any significant correction. Now let us compare this to this year’s election.
The Final Thoughts
What in the future for 2019? Analysing the Indian stock market during election years, we saw in this 2019 year we saw a sharp rally once the election was declared and started. But as the phases rolled out the market went into correction mode. We saw more than 5% corrections in the Nifty index, which shows the market is not yet confident about the absolute majority by any single party. It looks like whether it’s UPA or NDA or the local parties, an alliance government is on the cards.