This is an old post of mine that I wrote on 2009 in my blogspot. I thought that we can rewrite this in today’s context. In my trading career I have come across, many charting software and sites, costly or non-costly. The list is becoming endless with the advancement of technology: Metastock, Amibroker, Advanced Get, TradingView etc. But maybe we traders are ignoring a hidden free gem like the Yahoo Finance Chart. Thanks to Yahoo, we Indians get absolutely live charts to trade the markets, especially for our indices from Yahoo Finance absolutely FREE. You can get an auto-updating real-time Nifty chart from Yahoo Finance.
Step-by-Step Guide to Trade the Markets with Yahoo Finance Chart
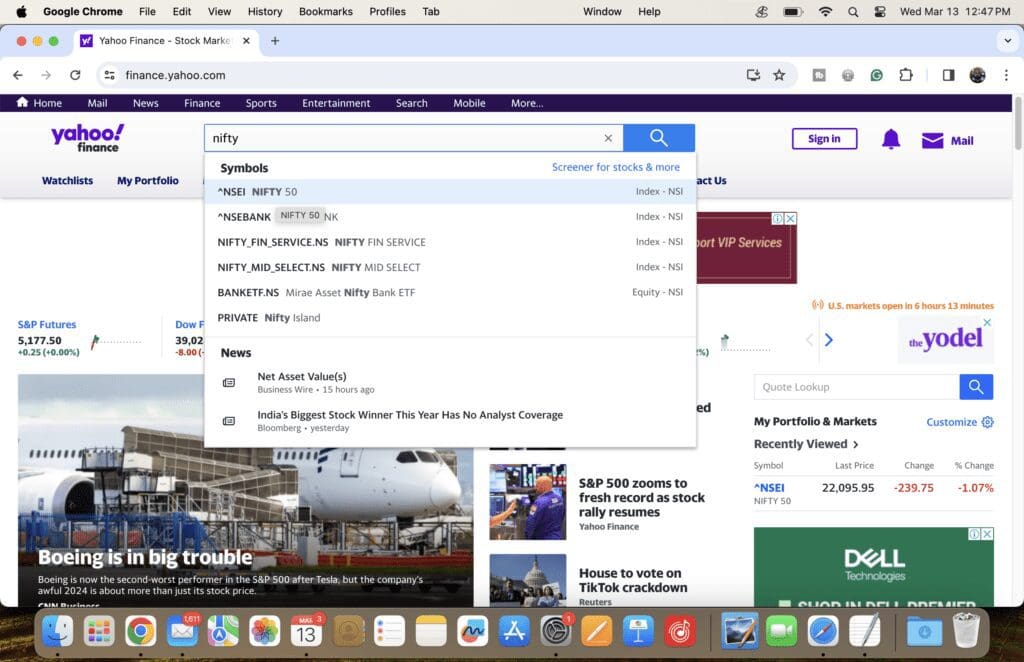
Firstly, open the website of Yahoo Finance.

Secondly, search for Nifty 50 in the search box.
This will open the details of Nifty 50. Now select the Chart option.
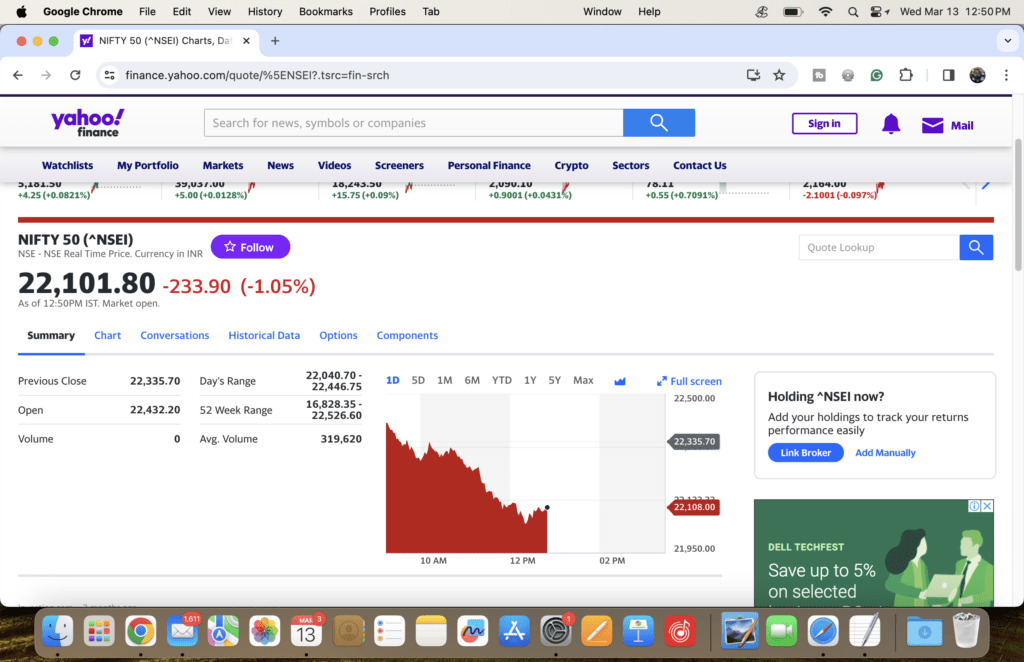
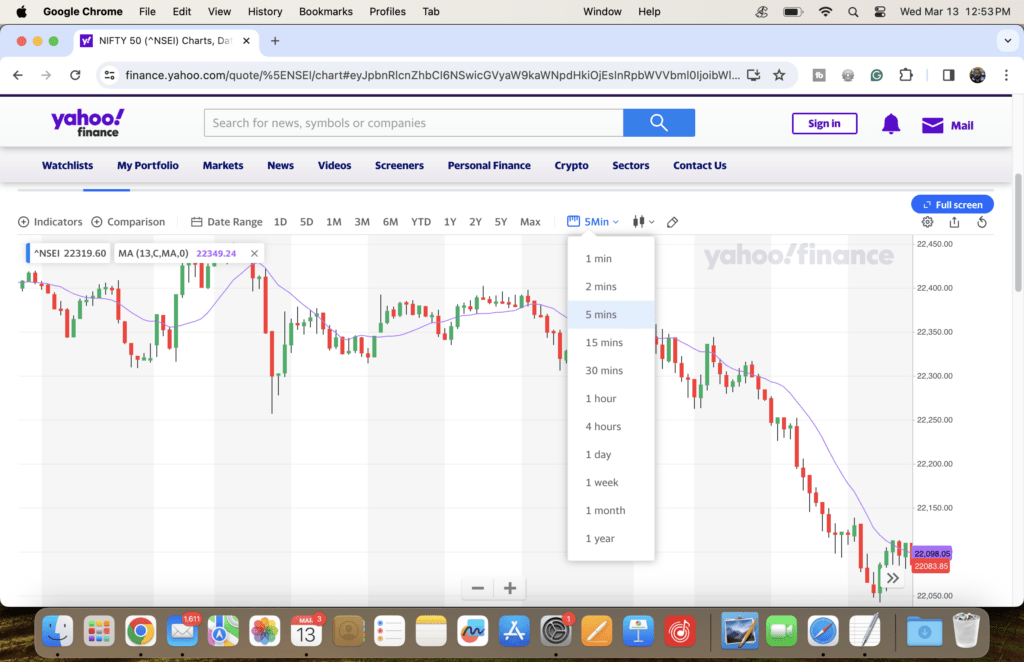
This will open Nifty 50 charts on the page. By default this is a Line Chart, convert it to a candlestick chart for a better view. Also, open a 5-minute chart for intraday trading.
The Tripple EMA Trading System to Trade the Markets
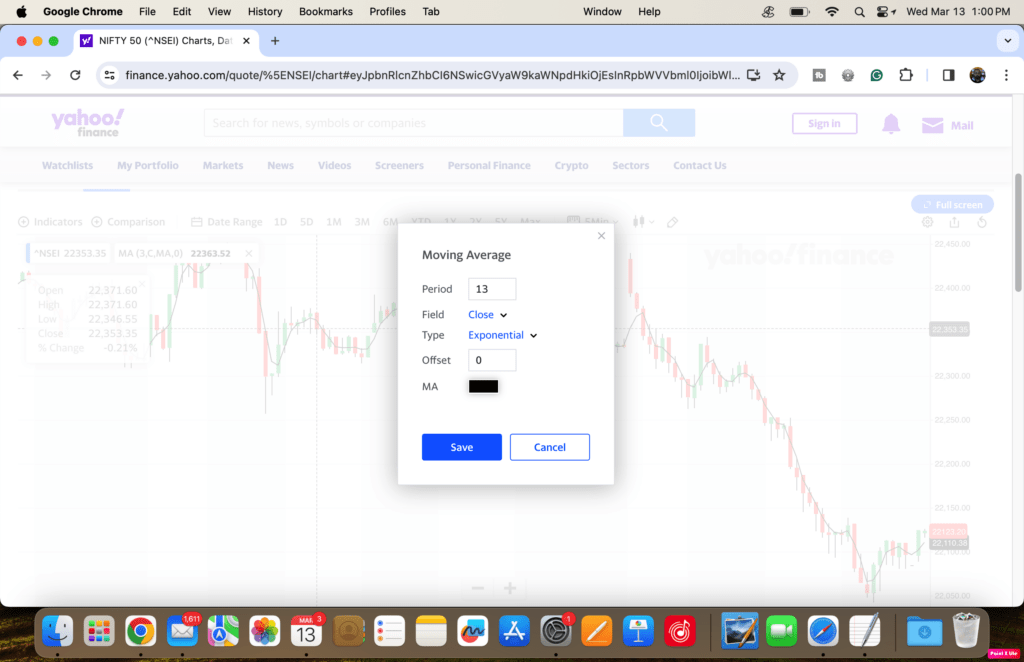
I repeat even a novice can successfully trade Nifty future using this chart. But how? Rules are again simple. We will add 3 moving averages, 3 minutes EMA, 13 minutes EMA and 34 minutes EMA in the charts. You can do so from the Indicators section.

Let us keep all the moving averages in black colour.


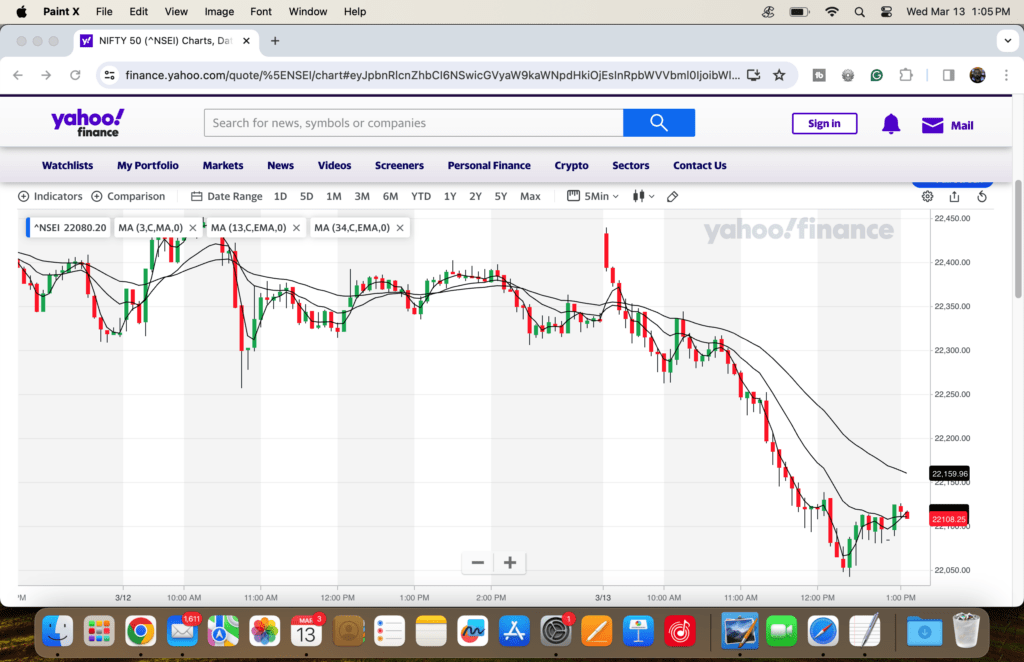
The final trading system looks like this.
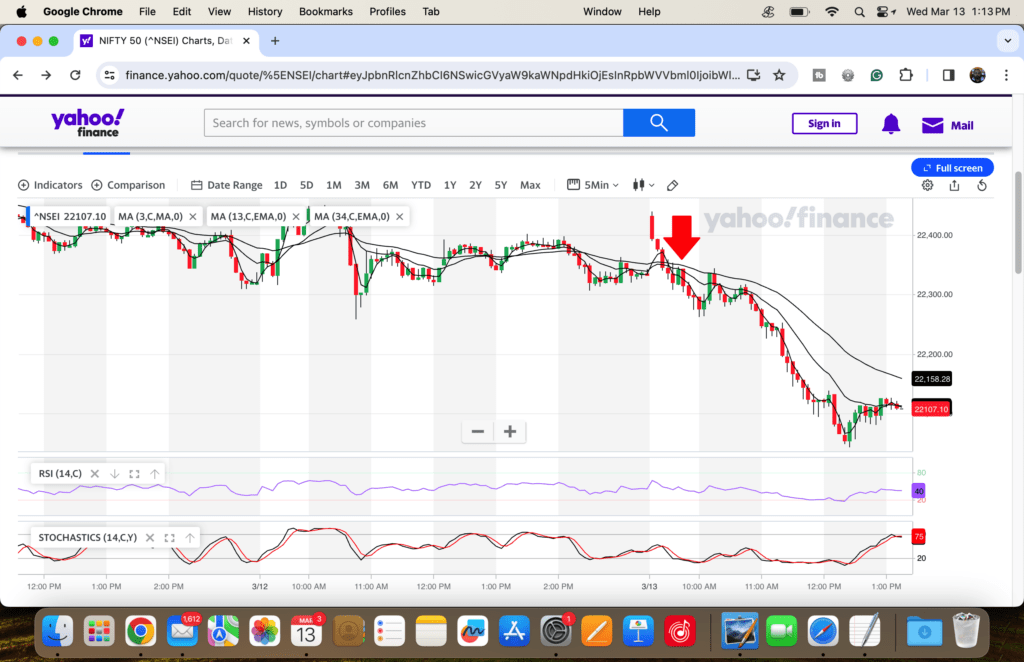
Let us add the Relative Strength Index and Stochastic indicator to the same charts.
Buy Nifty when 3 mins EMA goes above 13 mins EMA and 13 mins EMA is also above 34 mins EMA. Confirm the RSI and Stochastics are both in an uptrend and have not reached the overbought zone of 80. Exit Nifty longs when RSI and Stochastics both start coming down from the overbought zone.
Sell Nifty when 3 mins EMA goes below 13 mins EMA and 13 mins EMA is also below 34 mins EMA. Confirm the RSI and Stochastics are both in a downtrend and have not reached the oversold zone of 20. Exit Nifty shorts when RSI and Stochastics both start moving up from the oversold zone.
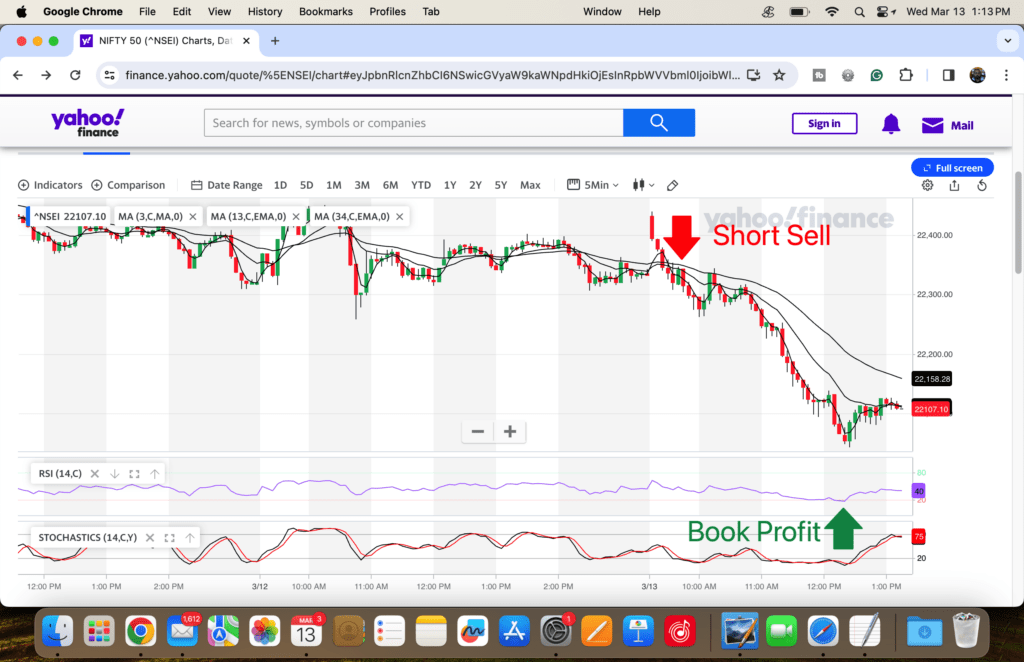
Now let’s see how you can make almost 280 points in Nifty today (i.e. 13th March 2023), just by trading the FREE Yahoo charts. I know a picture worth a thousand words, so I attached a picture of today’s trades.
You can book your profits if you see the RSI indicator touch an extreme.
Therefore, I discussed EMA crossover technology. This time I will discuss the Stochastic-RSI Ttading System.
Stochastics RSI Trading System with Yahoo Finance Chart
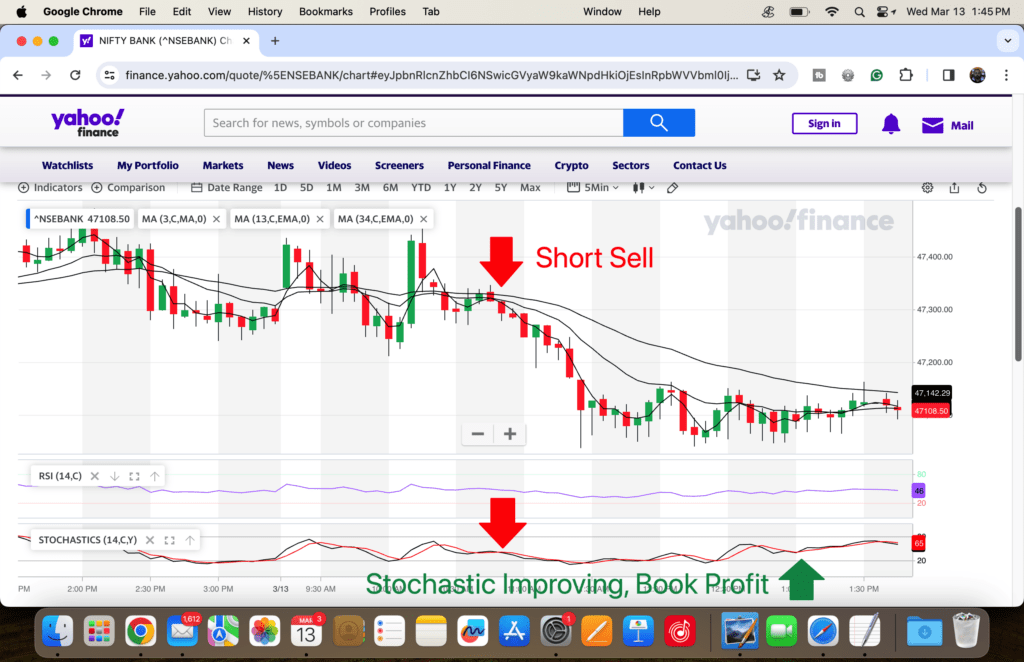
Let me tell you how you could make 265 points in Bank Nifty trading today using the Yahoo Chart. Rules are again simple: simply follow the auto signals.
Buy Bank Nifty when stochastics cross the black line over red and confirm that a full green candle is formed above all the 3, 13 and 34 EMA lines. Short Bank Nifty when stochastics cross the red line over black and confirm that a full red candle is formed below all the 3, 13 and 34 EMA lines. Exit criteria RSI reaching overbought or oversold zone or Stochastic starts improving. Also, sometimes the auto signals will tell you not to short at all, or sometimes it will tell you not to buy at all. Today’s trades are represented graphically.
Conclusion
In conclusion, utilizing the free Yahoo Finance chart can be a valuable tool for traders in the Indian market. By implementing simple trading systems such as the Triple EMA or Stochastics-RSI, traders can effectively make profitable trades in indices like Nifty and Bank Nifty. Following the rules and signals provided by these systems, traders can aim to capture significant points in the market movements. With the accessibility and ease of use of the Yahoo Finance chart, even novice traders can benefit from real-time data and make informed trading decisions. So, next time you are looking for a charting tool, don’t overlook the hidden gem of Yahoo Finance.
Your comments are welcome in this matter to take this discussion to a further height.


IN THE BANK NIFTY CHART U R SHOWING 3 MVG AVGS VIZ. 3.13 & 34, WHEREAS IN THE EXPLANATION U R MENTIONING ABOUT RED CANDLE CLOSING BELOW 21 EMA. THERE IS NO 21 EMA ON THE CHART. PLEASE THE CHART.
S V Rao, good observation, it was a typo error. It will be all the 3, 13 and 34 EMA lines.