I was going through the 5 minutes chart of Crude Oil February futures last Friday night. I found an interesting pattern in the Crude Oil chart. From the price pattern, a trading decision can be taken on the Oil contracts tomorrow. Buy in the morning or buy close to Friday’s close price. The Crude Oil target price of 4235 will be hit soon by Monday.
How I Calculated The Crude Oil Target Price?
The 5 minutes charts of Crude February Futures are showing an interesting pattern. The name of the pattern is Cup And Handle Pattern. In this pattern we see a decline followed by a slow round-shaped recovery, that forms the cup. Then a short dip again that should not come down to the lower part of the cup. That means that the final dip should remain confined within the upper half of the cup. This forms the handle. Watch the image below:
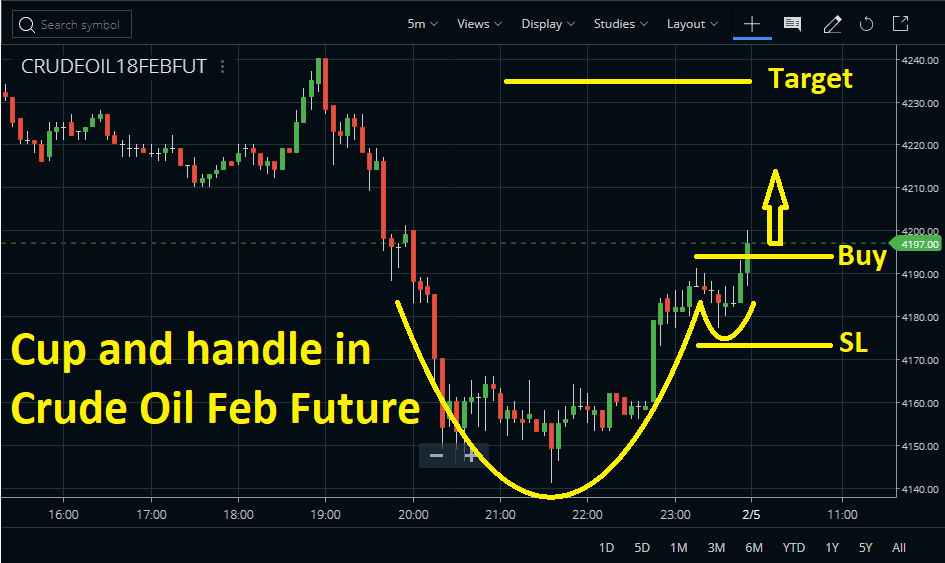
Now the trade should be taken once the handle breaks upside. The main advantage of this pattern is it has a small stop and a bigger target. You can identify this pattern in all time frames. 1-Minute, 5-Minutes, Hourly as well as Daily, Weekly, etc. Now, how I calculated the Crude Oil target price? We need to calculate the cup depth. Here, it is approximately 45 to 50 points. The target will be equal to the cup depth. So our Crude Oil target price equals the breakout point 4190 + cup depth 45 to 50 points. So the target is roughly coming to around 4235 to 4240. I hope this target will be achieved soon on Monday morning or by evening.


What Should be the Stop Loss?
In case of false breakouts, the price can retrace back to the lows and there can be sudden losses. Hence while trading futures, you should always trade with a defined stop. In this pattern, the stop loss should be below the handle low. So here the stop coming to roughly around 4175. So the risk vs reward is also good. Only 20 points stop loss against a target price of 40-50 points.
Prediction of Crude Oil Tomorrow’s Target
You can go long on MCX Crude Oil February contracts tomorrow morning or near the breakout zone with a stop below 4175 and a potential profit target of 4235.
Trade Update
Due to global factors, Crude Oil opened below the Stop Loss level. Hence the trade is not valid. But the readers can use this article as a typical example of the Cup And Handle Pattern and look for the pattern in the future. Not only cup and handle patterns, but traders can also look for different other patterns like Head and Shoulder, double tops, double and triple bottoms, etc to predict the trend of any security.
Conclusion
In conclusion, the Cup and Handle Pattern is a reliable technical analysis tool that traders can use to identify potentially profitable trades. While it didn’t work out as expected in this particular case due to global factors affecting the market, the pattern can still be used to make informed decisions about future trades. By understanding the depth of the cup and setting a defined stop loss, traders can minimize risks and maximize rewards. It’s important to remember that technical analysis should be used in combination with other market analysis tools to make the best trading decisions.


