Point and Figure Chart: P&F Chart Quick Guide
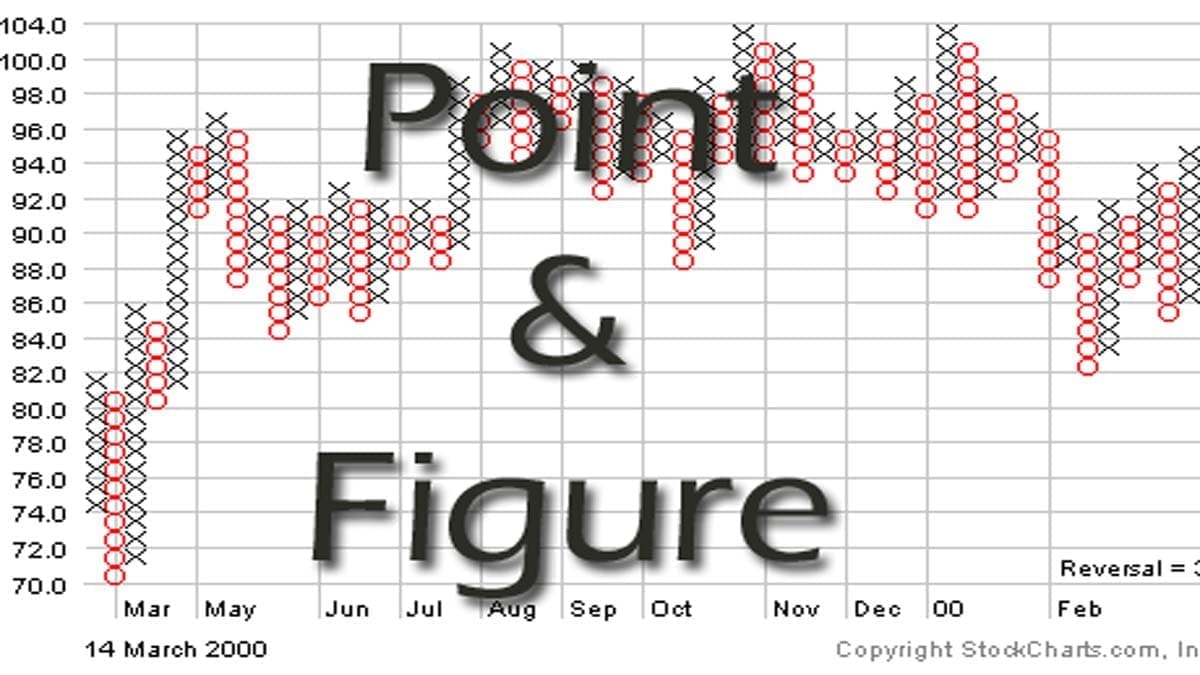
A point and figure chart (P&F) is a charting technique used in technical analysis. It is mainly used to attempt to predict financial market prices. The P&F chart is unique in that it does not plot price against time as all other techniques do. Instead, it plots the price against changes in direction by plotting … Read more