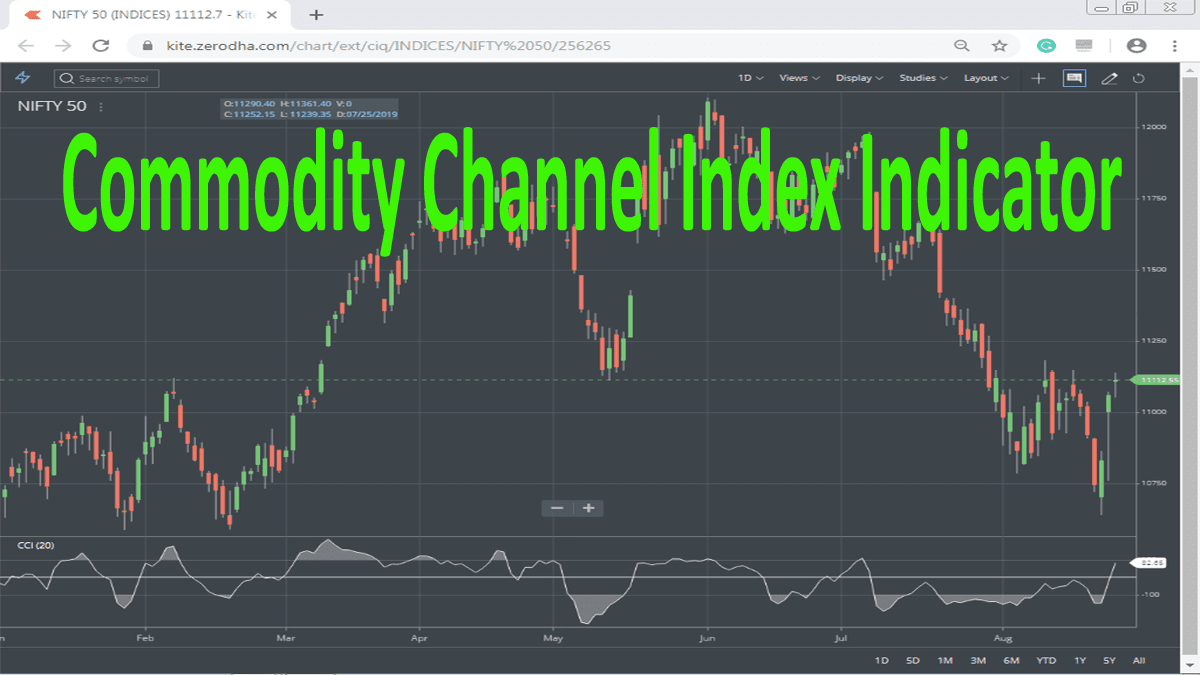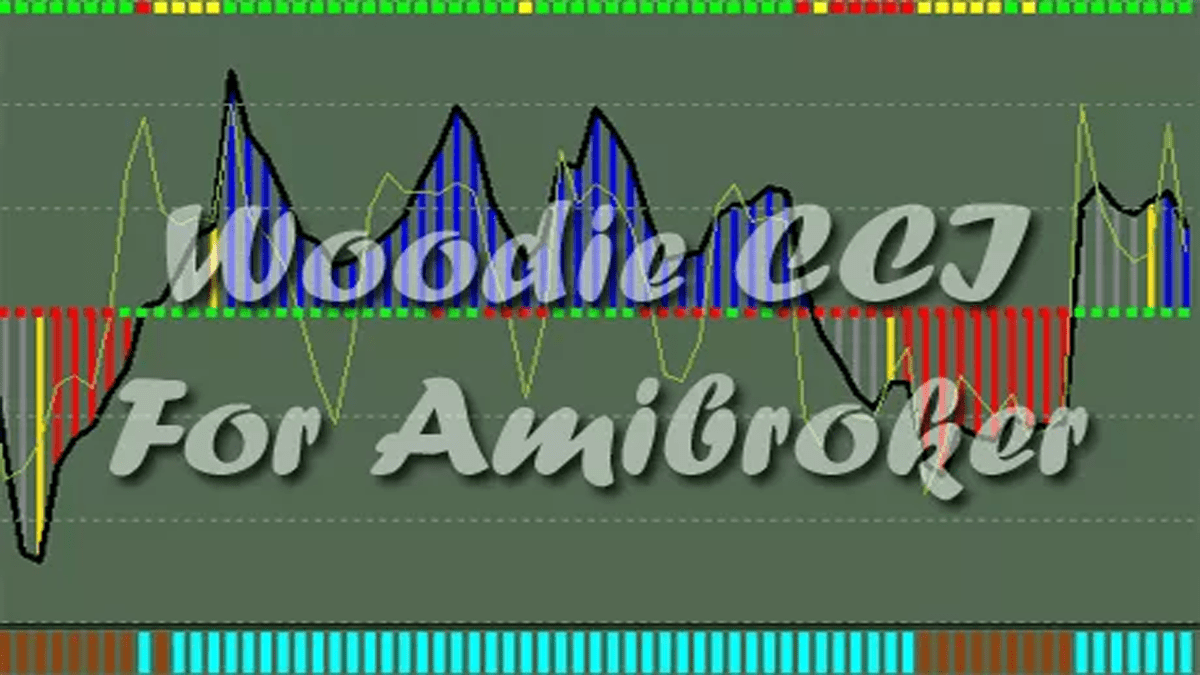
Woodies CCI was introduced by Ken Wood and the system has been named after him. It belongs to the category of momentum indicator. Before focusing on the Woodies CCI, let’s clarify the idea about CCI or Commodity Channel Index. Donald Lambert developed the CCI indicator in 1980. It is a versatile indicator, by using the indicator one can recognize new trends along with reverse trends. When prices are far above their average, CCI is generally high. The article will cover the basic concept of Woodies CCI and also will provide you with a buy-sell signal AFL for AmiBroker software.
What is Woodies CCI?
A famous personality Ken Wood introduced Woodies CCI and traders named the pattern in his name. In his name of him, a club has been introduced, Woodies CCI Club. The particular pattern comes under the category of momentum indicator. The Woodies indicator was based on the trading pattern on the Commodity Channel Index. It is based on the 14 periods of CCI. It is generally an unbound oscillator. The base value is 0 and it has no upper limit. Investors can spot a number of tradable CCI patterns both with and against the trend. The 200-level signal is an extreme reading. This indicator is often used in combination with other technical indicators.
Various Types of Woodies CCI Patterns & Buy Sell Signal
There are various types of patterns in the Woodies CCI. Our buy-sell signal AFL for AmiBroker can show most of the patterns easily. The names of the patterns are as per following:
- HFE (Hook From Extreme)
- Zero line reject or ZLR
- Trendline Break or TLB
- Ghost
- Vegas
- Famir
- Divergence Trade
- Money Management
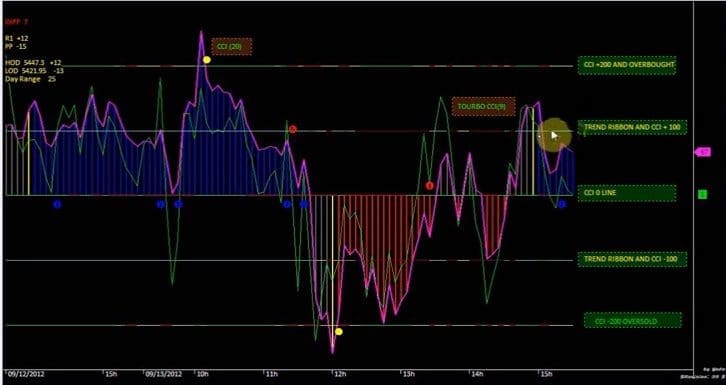
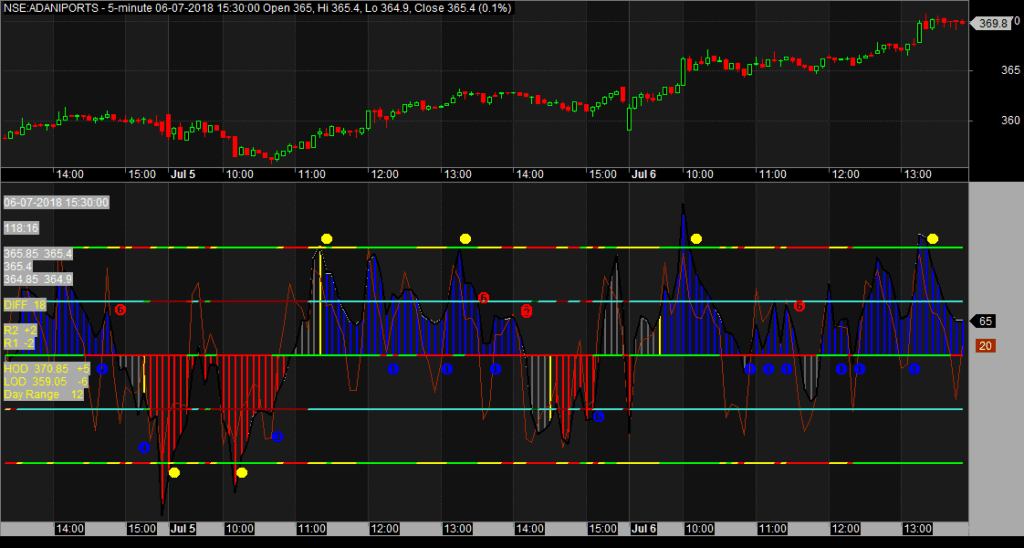
Here the blue bar represents the uptrend position of the market while the red indicates a downtrend. Grey lines show a reversal of a trend or a trend soon going to change. The trend reverse is confirmed after five consecutive grey bar happens. After appearing yellow bar trend change conforms.
Description of the 8 Woodie’s CCI Patterns and Buy-Sell Signals
Hook from Extreme
The Hook from Extreme trades is formed on the +200 or -200 area and then starts hooking or reversing back towards the zero line. Therefore, the name itself implies the pattern of HFE. It also considers a counter-trade pattern. The pattern formation happens quite fast. Remember one thing when you execute HFE trade, it does not mean you are supposed to stay in it forever, you need to follow the exit signal. However, it can provide you with a huge profit.
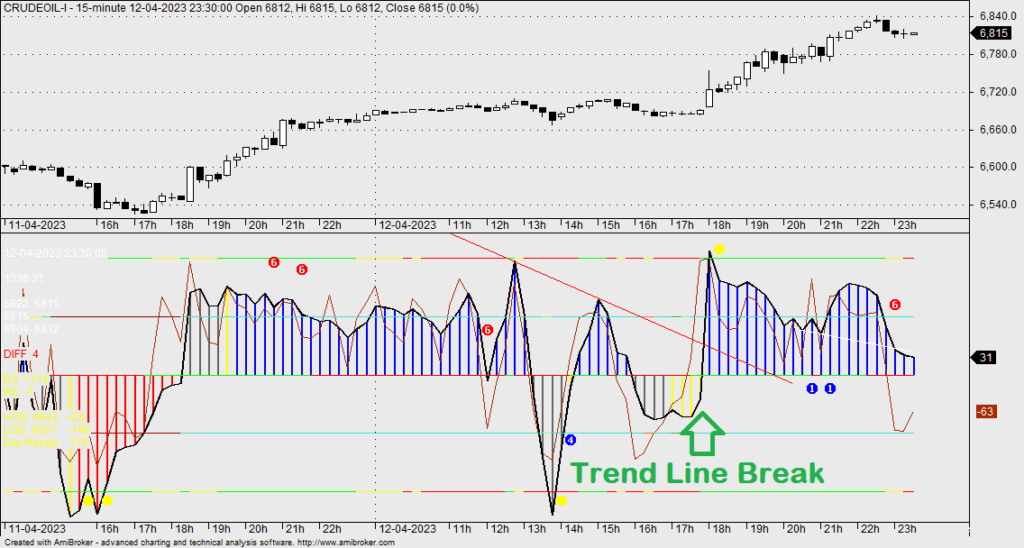
Trendline Break
This particular pattern connects two high or low. The trade can happen in both countertrades and with the trade. Through peaks and valleys (that line up across the chart to form a trend line break), this pattern can be identified. When the line is broken, the trade generates its signal. TLB includes both counter-trend and trend trade.






Vegas
Vegas is a combination of certain things, firstly it needs to hook from the extreme then followed by a rounding of the CCI. This rounding pattern must consist of a minimum of three bars. The rounding can be formed in any direction. The entire pattern must form on the same side of the zero line, considers a strong signal. The rounding part plays a very significant role here, indicating a trend reversal. Vegas forms with around 8 to 12+ bars.
Famir
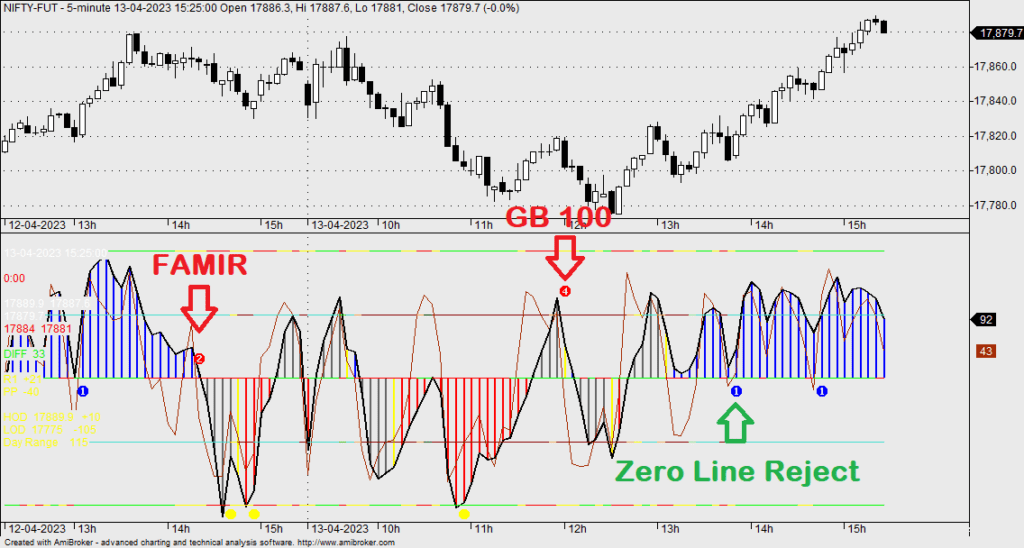
Famir is almost the same as the Vegas pattern. The distinction between the two is Famir appears near CCI zero line. The second mountain is a small one, indicating a fast reversal pattern.
Zero Line Reject
The name of this pattern itself defines its meaning. When CCI approaches or crosses the zero line after that turns back to the previous level, the pattern forms. Traders can combine the ZLR pattern along with the Trend Line Break pattern.
Ghost
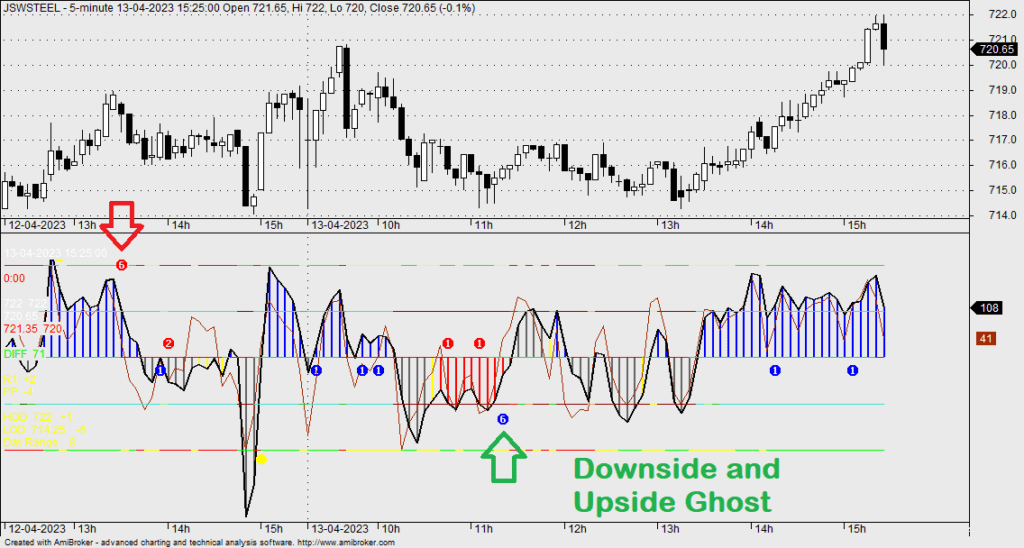
The pattern is almost the same as the Head and Shoulder pattern and belongs to the counter-trade pattern. The only difference ghost pattern doesn’t have to cross the neckline. The pattern consists of three peaks.
Tony Trade
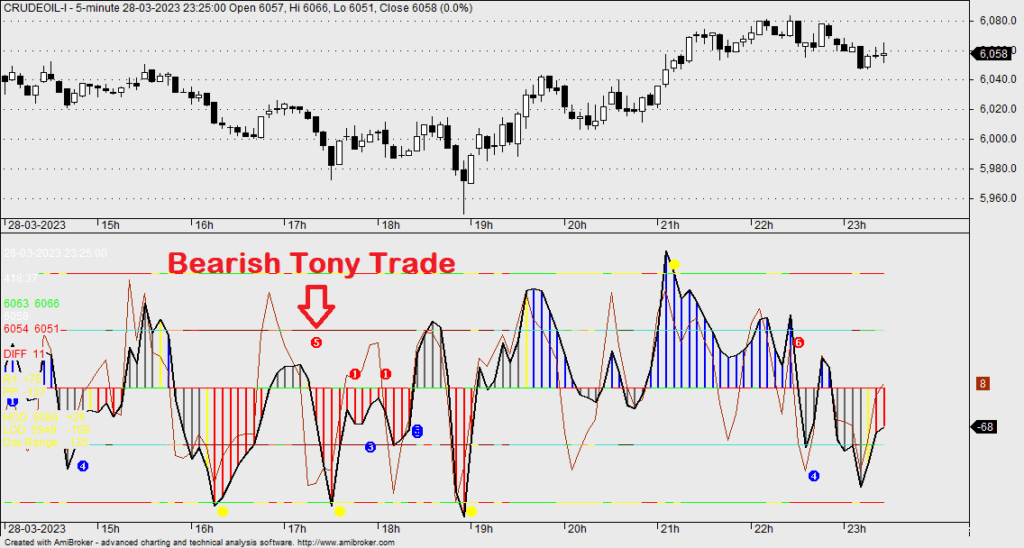
The pattern begins to form crossing the zero line. The trade of this pattern can be aggressive in nature. Crossing the zero line for four bars minimum being printed. It considers a strong signal.
Divergence Trade
This is also similar to MACD / RSI / Stoch. Here the bull price is lower low and CCI makes a higher high in the long trade.
Money Management
Before taking the entry, find out how much risk is there. Do not enter the trade in between without patterns, Avoid entry near 0 lines.
So, above are some basic points regarding the patterns.
Woodies CCI Buy Sell Signal AFL for AmiBroker
Check the below image to know what the Woodies CCI AFL code for AmiBroker looks like.
You can click this link to get the Free Woodies CCI indicator formula.
FAQ
The Woodies CCI (Commodity Channel Index) indicator is a technical analysis tool that helps identify changes and reversals in price trends. It uses average true range to analyze price movements and provide more reliable signals than traditional indicators like moving averages, volume, etc.
Woodie’s CCI calculation involves taking the following steps- calculating an exponential moving average of high/low prices, plotting the average minus or plus 0.15 times the exponential moving average, banding at +100/-100 levels and then plotting a line between each of these levels for further analysis.
In the Zerodha Kite platform, you can use the built-in Commodity Channel Index (CCI) as a trading aid to spot overbought & oversold conditions that signify shifts or about-turns in market direction when used along with other tools on various intraday timeframes ranging from 5 minutes up until day charts, etc.
Different traders have different views about what constitutes “normal” or “good” scores for Commodity Channel Index readings among other factors such as timeframe., but generally speaking values above +200 suggest overheating markets while below -200 show lackluster demand indicating downward pressure; However it should still be checked against multiple channels before making any trading decisions.
Conclusion
In conclusion, Woodies CCI is an invaluable tool for stock market traders. It allows traders to analyze the markets, make better trading decisions, and increase their chances of success. The indicator is easy to use and provides traders with a visual representation of price movements. With Woodies CCI, traders can easily identify buying and selling opportunities in the stock market. We have also provided a buy-sell signal AFL for AmiBroker software. Your comments regarding this indicator will be welcome.