
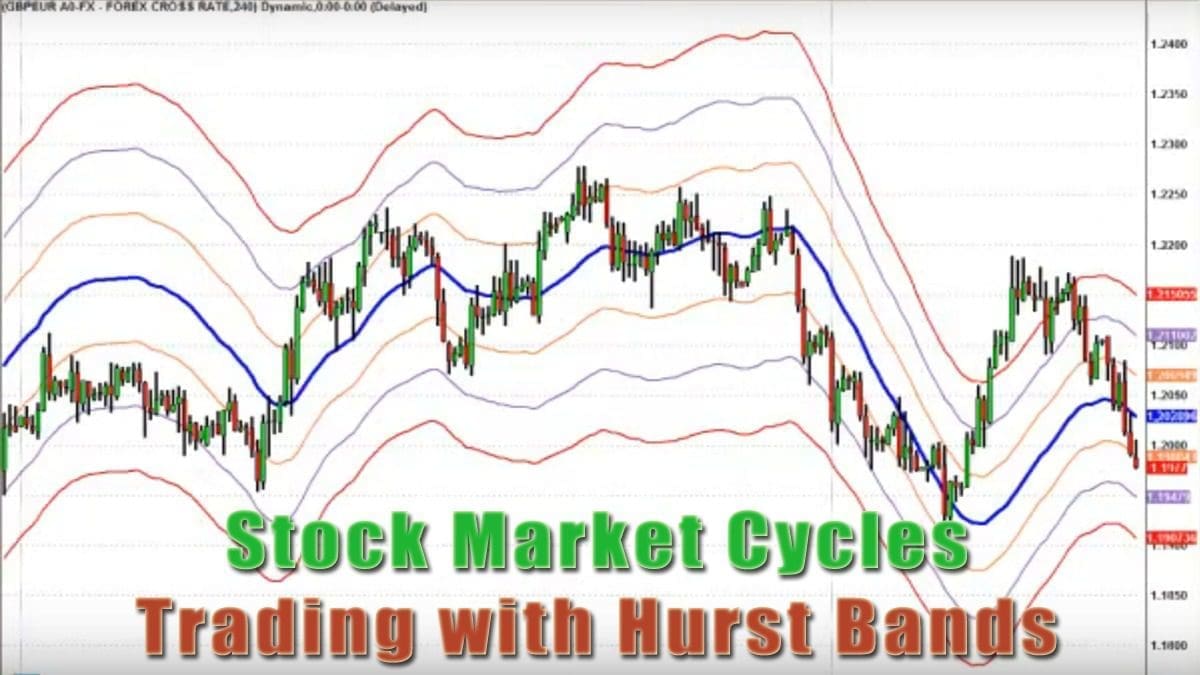
I have seen that the stock markets work in a cycle. There is not always an uptrend and there is not always a downtrend either. These changing behaviours of the stock market are called the stock market cycles. In this article, I will show you what is cycle principle and how you can trade these visible cycles in the market using Hurst Bands AFL in AmiBroker, our favourite charting platform.
What is the Stock Market Cycles?
By definition, a cycle in the stock market is a time period within which a series of regularly recurring phenomena or events are completed. The cycle principle has been introduced by a man called JM Hurst who has written a book named Profit Magic of Stock Transaction Timing way back in the 1960s. This book is still available today and has been very popular over the years. In this book, he has presented a very small portion of his full cycle theory. Cycles affect the price movements in the financial markets.
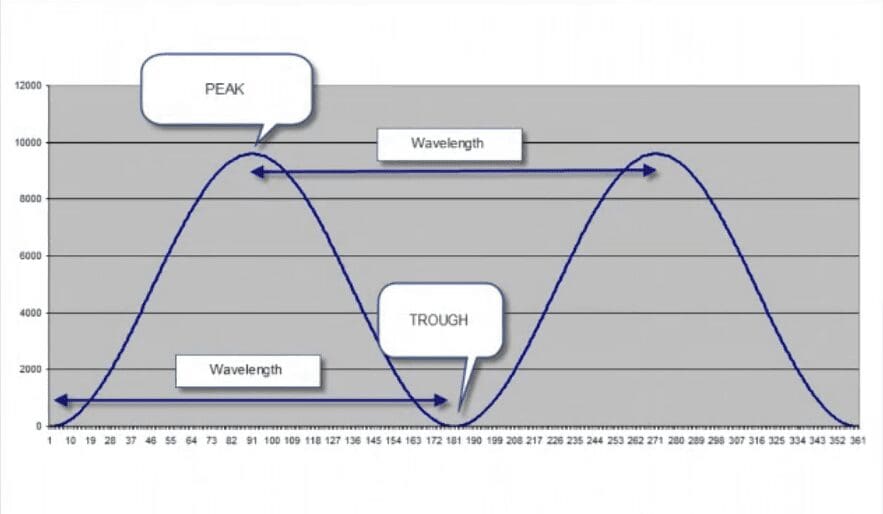
The stock market cycles go from positive to negative and back to positive again. It carries on like this for an infinite time. During its course of action, the market creates peaks and troughs as shown in the picture. The time period between 2 peaks or troughs is a wavelength.
The 5 Basic Concepts of Stock Market Cycles
Multiple Cycles
There are multiple cycles that influence the price movement in the stock market. In fact, there can be an infinite number of cycles present. But you need not know those infinite number of cycles. All you need to know is to identify as many cycles as you can.
Cycles Exist in Continuous Time
These cycles affect the financial markets 24 hours a day, 7 days a week and 365 days a year. The cycles that affect the financial exchanges exist in a Harmonic Nominal Model as per JM Hurst. The wavelength in this model is also related to a simple harmonic ratio.

As we can see from the image above that the longest cycle that Hurst considered was 18 years. Similarly, the shortest cycle considered by Hurst was 5 days. You can see the average wavelength in days and years are also mentioned in the image above. In the subsequent studies by Sentient Trader, the cycles are broken down to as low as 3 minutes as seen in the image. Why they call it a harmonic nominal model because the cycles exist in harmonic relationships. 18 years divided by 9 years is 2:1. Similarly, 54 months divided by 18 months is 3:1.






Variation in Wavelength
This theory tells that the wavelengths will vary in actuality from the average wavelengths given in the table.
Synchronized Troughs
The cycles that can be identified will have synchronized troughs. That means they do not have synchronized peaks. We can understand this if we see a picture with multiple cycles.
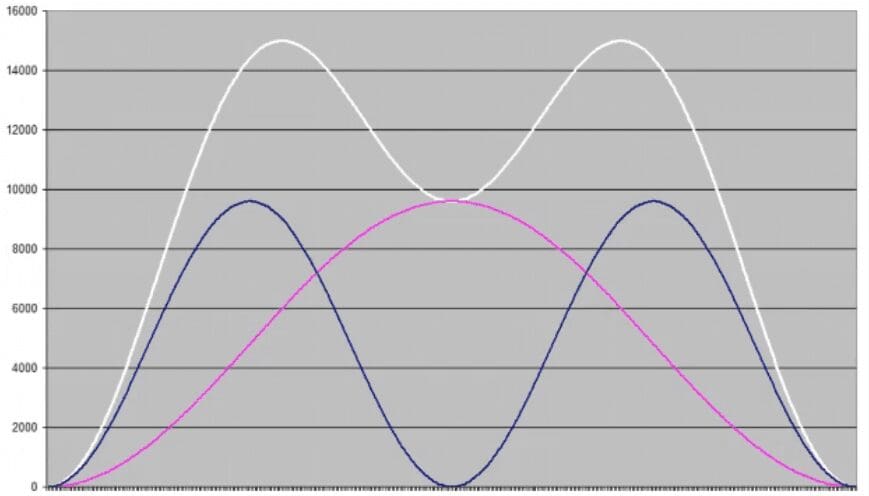
There are 2 cycles one is blue and the other is pink. We have shown the combined results of the 2 cycles in a white line. You can see that the troughs are synchronized while the peaks are not. This is a very important concept and defines how stock market cycles work together. You can see that due to multiple cycles, the resultant cycle (white line) will look like the word M.
Underlying Trend
We have understood that there will be multiple cycles in the market. But in reality, we are going to trade only one. The underlying trend of our trading cycle is the combined effect of all the cycles longer than our trading cycle. So we need to analyze the trends of the longer cycles whether the price is moving up or down. If it is moving up then we add +1 and if it is moving down then we add -1. Suppose checking 4 longer cycles we got the underlying trend of our trading cycle = (1 -1 + 1 + 1) = +2. So the concept of the underlying trend is very important in making the trading decision.
Stock Market Cycles FAQ
The stock market cycles can be shorter or longer. The longest cycle that has been identified is of 18 years and the shortest cycle identified was 3 minutes.
The full market cycle is the market moves up, moves down and moves up again. So it is the journey from a trough to a peak and back to a trough and back to another peak again. So this covers a bull phase, a bear phase, and a bull phase again.
Market cycles are a normal part of stock trading and they can form by various factors such as the economy, political landscape, changes in demand, news developments, or even investor sentiment. It is important to research and analyzes trends when trading on the stock market to maximize profits during each cycle.
Hurst’s cyclic theory is a market prediction methodology based on long-term wave cycles. It uses an analysis of stock price movements to predict where the prices will go in the future. J.M. Hurst developed the approach and provides investors with information about what direction the markets are likely going next, making it useful for both short-term and long-term investments in any kind of stock market worldwide.
What is Hurst Bands?
The Hurst Bands is a statistically effective mean reversion trading tool. It is based on regression formulas which create deviation channels that can be projected into the future. In simple terms, the Hurst Bands provide a continuously mathematically verifiable entry, trend confirmations, and also exit signals. You can trade the stock market cycles easily using the Hurst Bands.
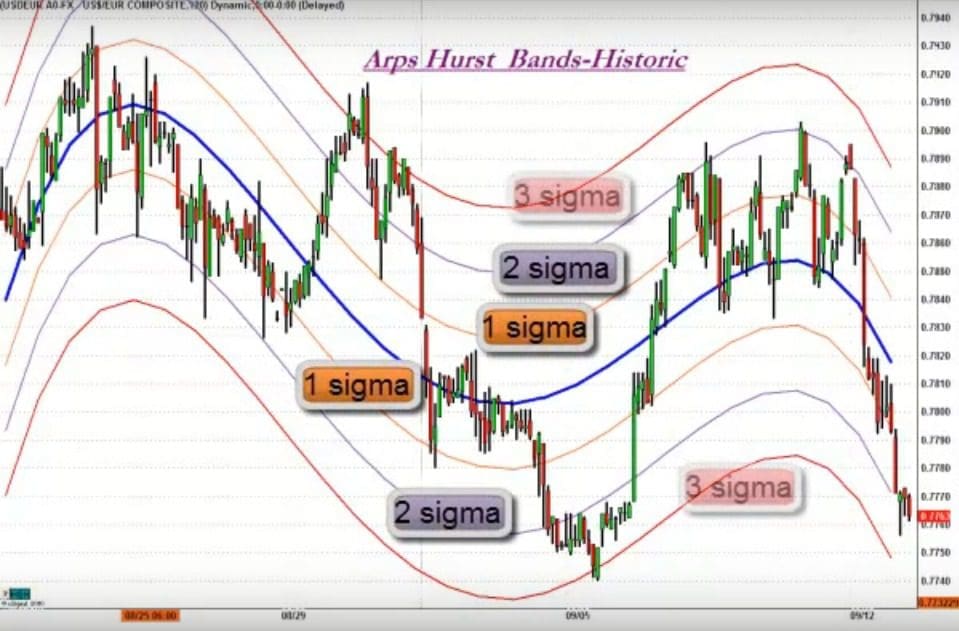
In Hurst Bands there are lines drawn from 1, 2 and 3 fractional deviations or sigma away from the current market price. Statistically, there is only a 5% chance of the price breaching beyond the 2-sigma. Also, there is only less than a 1% chance that the price will breach beyond the 3-sigma. So when the price approaches these lines a relatively low-risk entry opportunity arises to trade in the opposite direction.
We will be trading the Hurst Bands using AmiBroker and I am providing you with a download link of Hurst Bands AFL for AmiBroker. Whenever we apply this indicator to a chart, a curvilinear structure will appear on it. We can consider the price touching any extreme of the bands for an entry in the opposite direction. Hurst has recommended keeping a trailing stop loss on the trades.

The Download Link to the Hurst Bands AFL for AmiBroker
I have provided you with the download link to the AmiBroker AFL. I have tested that it works on AmiBroker version 5.60 and above. You can download the same from here.
How to Trade the Hurst Bands?
The trading procedure is simple. But when the price touches the lower band and tries to move higher the next day. Sell when the price touches the upper band or just sell as soon as you lock your profit. Works pretty well in NSE as well as any market situation. It works in sideways markets very well. The drawback of this AFL is that it does not work very well in the trending markets. So I suggest using this indicator in conjunction with the ADX indicator. Use this in the low ADX situations, which clearly denote that the market is rangebound.
Suggested Reading

We suggest you read the original book by JM Hurst to master this subject.
Conclusion
It is evident that stock market trading with Hurst Bands AFL can be a profitable endeavour. This approach helps traders to gain an edge over the markets and keep their gains consistent over time, by exploiting the periods of trending behaviour and minimizing drawdown risk during downturns or ranging markets. The flexibility of Hurst Band AFL also allows traders to customize the settings according to their own unique strategies. With proper usage and discipline, traders can reap good profits from trading with Hurst Bands AFL on the stock market cycles.


sir hurst band me kaise trade karte hai mere kewal zerodha ka kite version hi use karta hu
Nitesh for this you need AmiBroker in your system. We have given a code on AmiBroker.