Japanese Candlesticks, as the name suggests, were first invented by Japanese rice traders in 1600 to predict the price movement of rice. Steven Nison was credited for popularizing it later. To some traders, candlesticks create so many signals, these appear mystical to them. Proper knowledge and candlestick chart pattern analysis can help traders a lot. Through this article, it will be our endeavor to focus on the basics of candlestick chart so that our readers can take up further studies into advanced candlestick analysis.
Candlestick plays the role of a great indicator. Candlestick chart pattern conveys a lot of information about price movements over a specific period of time. This is the most important thing to determine market direction. So these are valuable information for a trader. In this post let us describe various candlestick chart pattern analyses and a full list so that traders can identify them in real life.
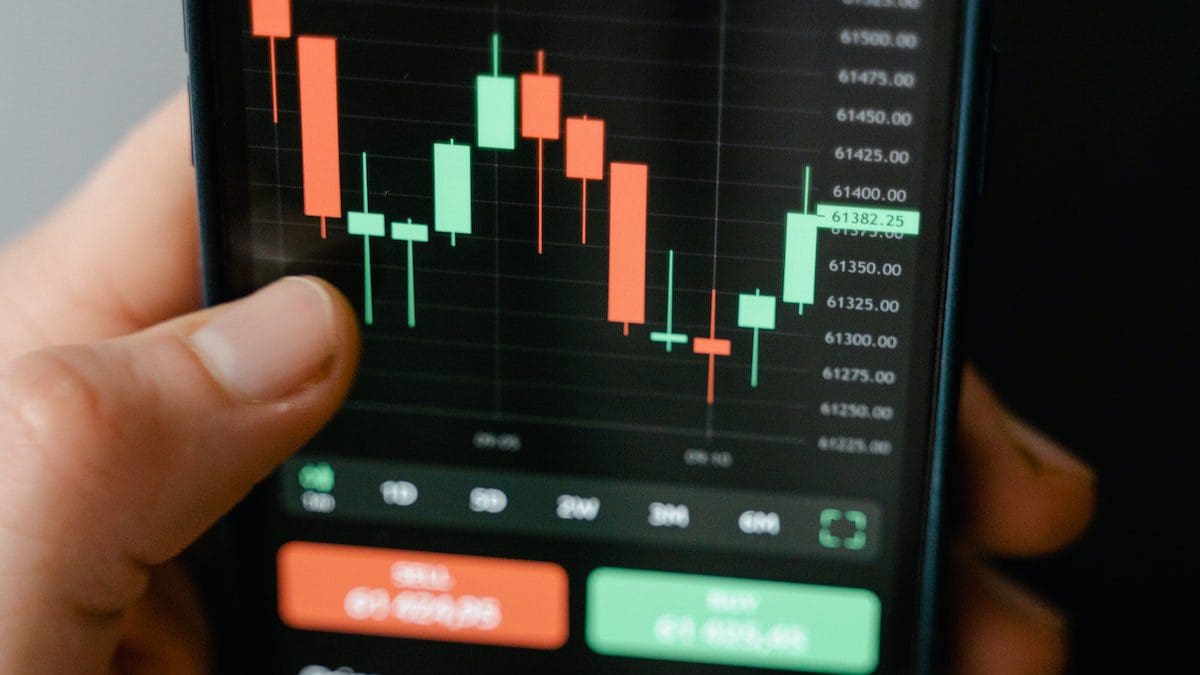
There are different time frames in the candlestick charts, it can be changed from 1 min to 1 month.
Understanding a Candlestick Chart
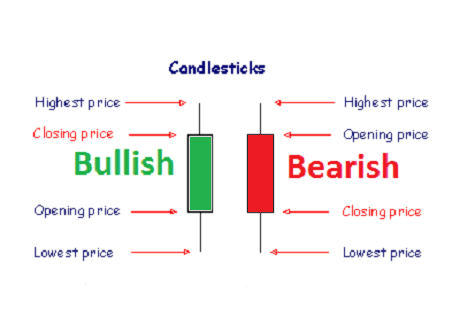
As shown in the figure above, in general, when the opening price is well below the closing price, the candlestick shows a bullish pattern and inversely, when the closing price is far below the opening price for a particular period of time, the candlestick gives a bearish signal. The highest price and lowest price in that particular period from the tails/ shadow and the price difference in opening and closing price form the body of the candlestick. The candlesticks can be of any time frame – one tick, 1 min., 5 min., 15 min., daily, weekly, monthly, or yearly.
Bullish and Bearish Candlestick Chart Patterns
In this candlestick chart pattern analysis, each candlestick consists of four main points. It has one main rectangular body which interprets the opening and closing price. Basically, two different colors are used to distinguish bearish candles from the bullies.
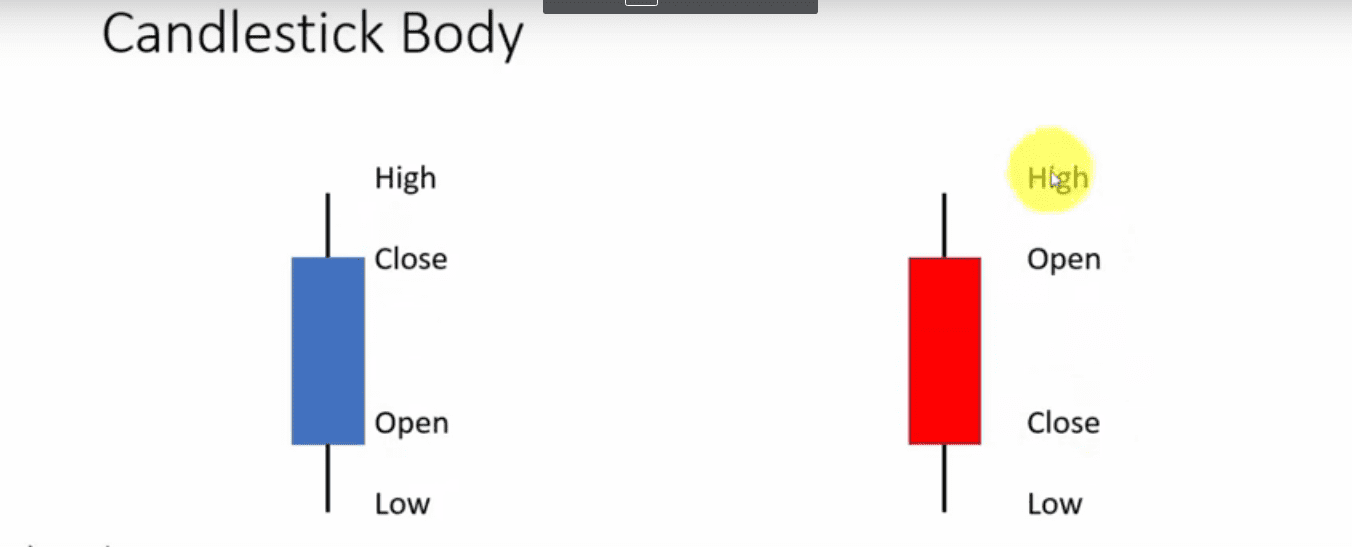
Bearish indicates a price decrease, the top of the body shows the opening price and the bottom of the body shows the closing price. Bullish refers to the price increase. They are reversedly categorized, the bottom indicates the opening price and the top body indicates the closing price. Generally, the green candle represents bullish and the red candle represents bearish.
The lines coming off from the candle are known as shadows. The shadows represent the highest and lowest prices of a specific period.
CandleStick Chart Patterns for Technical Analysis
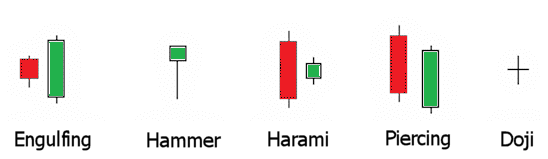
There are several types of candles in the candlestick chart pattern analysis. Each pattern has a different meaning and information.
As I have mentioned earlier that there are several charts pattern, among them the Marubozu candlestick, Dozi candlestick, Hammer candlestick, Inverted hammer or Shooting hammer candlestick, Bullish engulfing candlestick, Bearish engulfing candlestick, Tweezer Tops & Bottom candlestick is quite important in the trading market.
Major Candlestick Chart Patterns
Analysis of Different Candlestick Chart Patterns
Now let us check all the different Japanese candlestick patterns one by one.
Spinning Top Candlestick
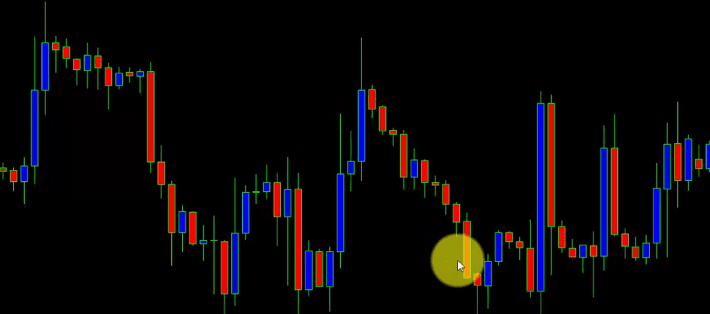
One of the most important patterns is the spinning top. The spinning top candlestick has a very small body and long shadows. In spinning top candles the difference between opening and closing price is low. Spinning top candles helps traders to predict the market reverse.
Marubozu Candlestick
Marubozu candlestick has no shadow at all, it only has a different opening and closing price. It is a very useful indicator to predict the reverse situation of the market sentiment. It can be bullish or bearish. This candlestick mainly interprets the reversal or continuation of the market trend.

<
Doji Candlestick
Doji, an important type in the candlestick chart pattern analysis consists of three types, Classical Doji, Gravestone Doji, and Dragonfly Doji. In Doji the opening and closing prices differ by a very small amount.


Doji has a long shadow but doesn’t have any particular body. It interprets that the previous trend is coming to an end. Its closing and opening price is the same. Doji implies indecision among traders meaning traders are not following a particular trend. The opening price and closing prices are nearly the same highs and lows are away. Doji, when combined with other patterns gives different signals. There are also many variations of Doji.
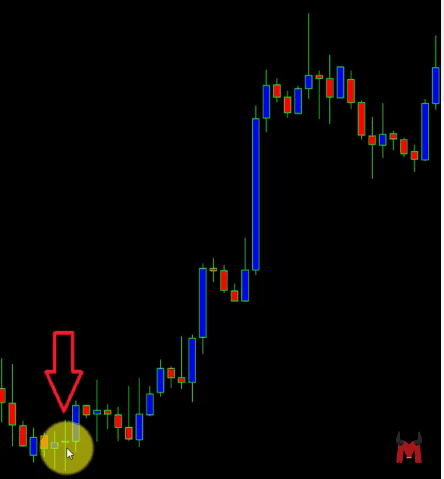
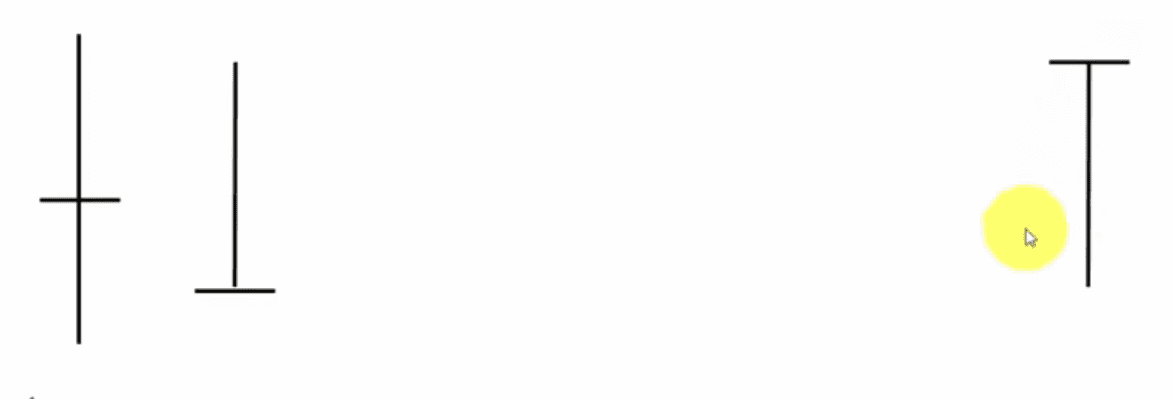
Hammer Candlestick
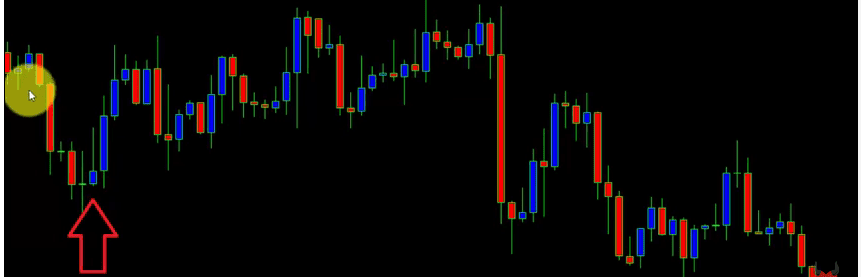
This Hammer candlestick represents the bullish trend reversal. The candlestick has a small body and a long shadow. It is characterized by a short body followed by a long lower shadow indicating a significant lowermost point. The upper shadow is non-existent or insignificant. It can be bullish or bearish. A bullish hammer candlestick always appears at the bottom. when sellers try hard to pull down the market, buyers remain optimistic and push the market up. It is a bullish signal if occurs after a significant downtrend.
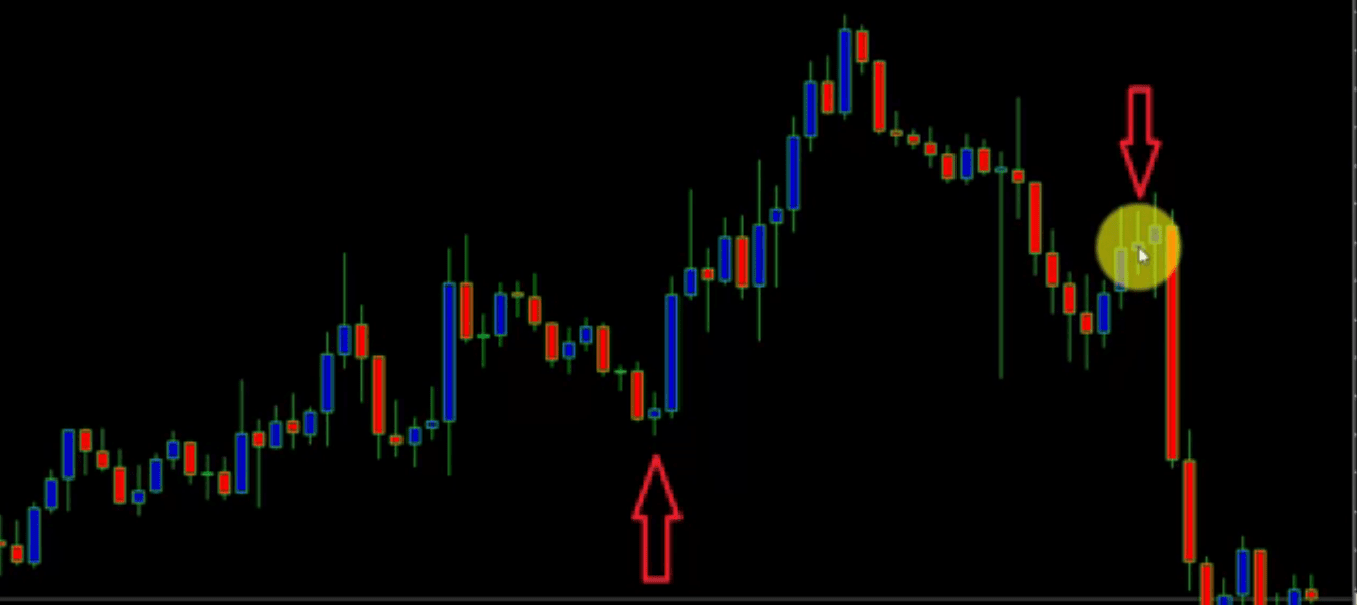
Inverted Hammer and Shooting Star
The two are almost the same. In the case of the inverted hammer, after a downtrend, it appears. This candlestick interprets that the interest of buyers is high, so its trend is the reversal.
And in the case of the shooting star, after an uptrend, it appears. It represents that the sellers are back in the game, and the buyer’s interest is going down.
Bullish Engulfing Candlestick
There are two candlesticks in this category. It is characterized by a small bearish candle followed by a large bullish candle which is essentially much bigger than the bearish candle. 1st candlestick is bearish and the 2nd one is bullish. It comes after a downtrend. the 2nd bullish candlestick completely covers the 1st bearish one. This represents a powerful prediction after a long downtrend. Overall, it’s a strong bullish pattern if it occurs after a significant downtrend.
Bearish Engulfing Candlestick
This candlestick becomes strong after an uptrend. In this case, the price may go down.
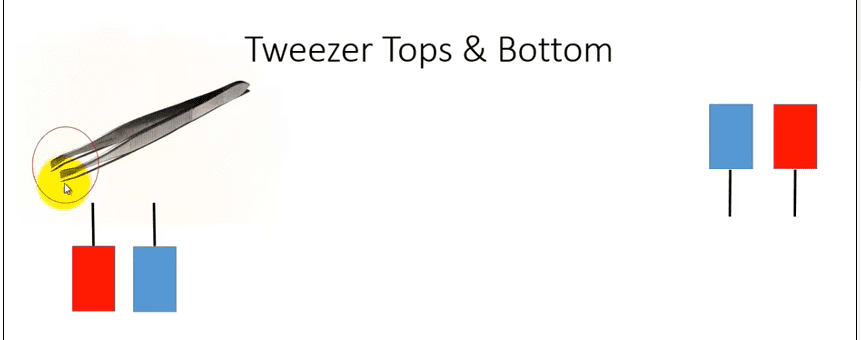
Tweezer Top & Bottom candlestick
There is a difference between tweezer tops & bottom candlesticks. The bottom appears after the downtrend and the top appears after the uptrend.
In the Tweezer Top, the lower body should be the same. There is no shadow at the bottom of the body. The market goes up here.
In the Tweezer Bottom, the Upper body should be the same. It is the reverse version of the Tweezer Top, so there is no shadow on it. the top of the body. The market goes down here.
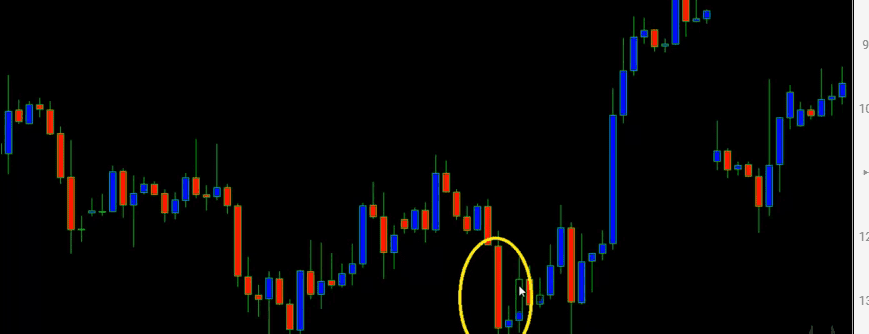
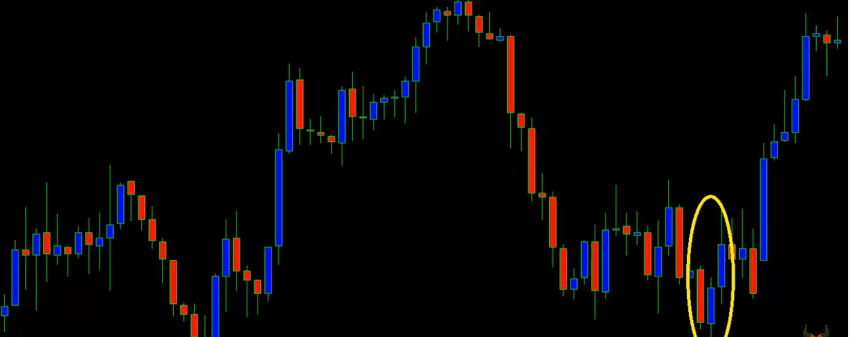
Morning Star Candlestick Pattern
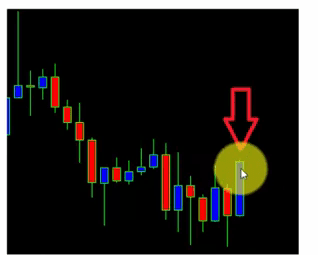
It is a three-candlestick pattern, the 1st candle is bearish, and the 2nd candle is a small body candle. The 1st candle is always higher than the 2nd one. Here 2nd candle or small body candle interprets indecision in the market. When there is no clarity between buyers and sellers, indecision appears. This candlestick comes after a downtrend. It predicts the market will go up.
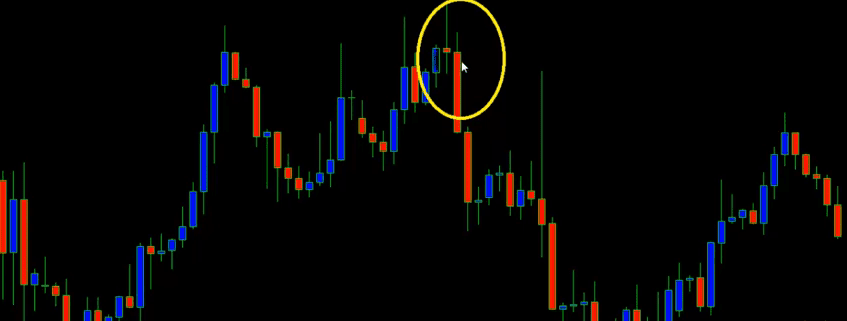
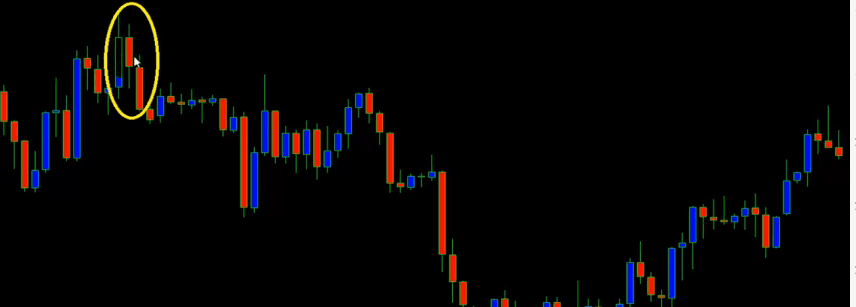
Evening Star Candlestick
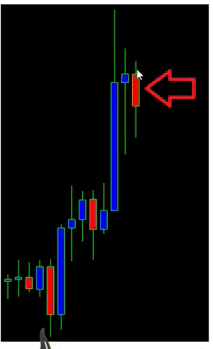
It also consists of three candlestick patterns. 1st one is bullish, 2nd one has a small body and represents indecision between buyers and sellers. The 3rd candle is the bearish candle, it closes below the midpoint of the 1st candle. It interprets market may go down.
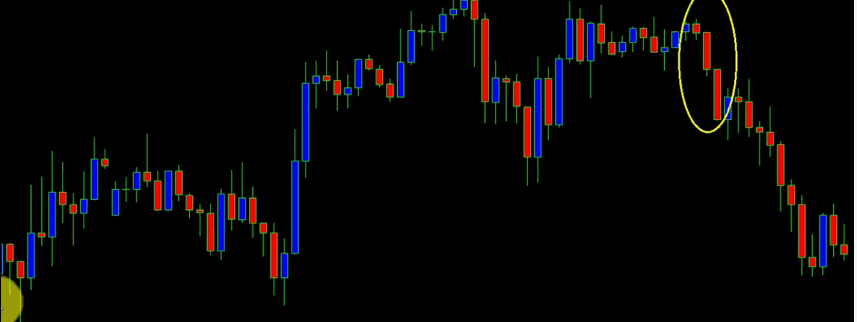
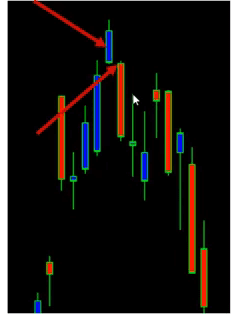
3 Black Crows Candlestick
It consists of 3 candlesticks. 1st is the bearish candle, 2nd one is also bearish and bigger than the 1st candle. 3rd one is a big bearish candle with almost no lower shadow. It comes after an uptrend and therefore market goes down after the candlestick pattern. This is one of the most important signals for traders.
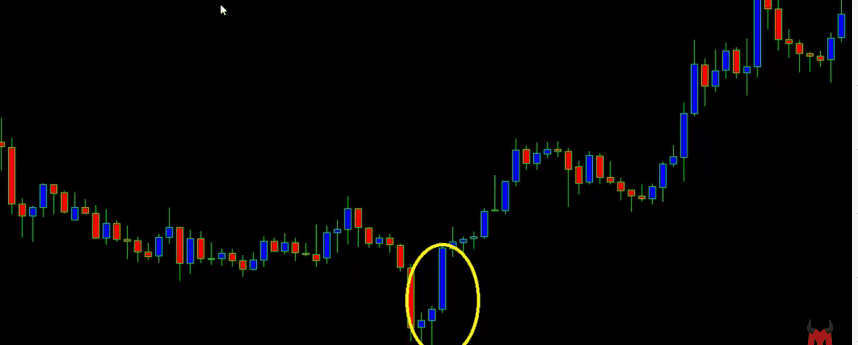
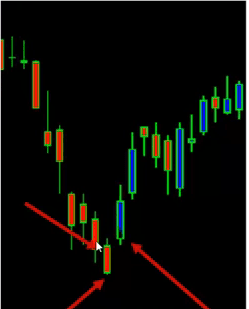
3 White Soldier Pattern
This pattern has 3 candlesticks. All 3 of them are bullish candles. The 2nd candle is bigger than the 1st candle. The 3rd candle has no upper shadow at all. This pattern comes after a downtrend and pushes the market up.
3 Inside up Candlestick Pattern
There are 3 candlesticks in this pattern. The 1st candle is bearish, 2nd one is bullish and it closes above the midpoint of the 1st one. The 3rd candle is bullish and it closes above the entire body of the 1st one. It comes with a downtrend and interprets an optimistic buying level.
3 Inside Down Candlestick Pattern
It consists of 3 candlesticks. 1st one is bullish, 2nd one is bearish and it closes below the midpoint of the 1st candle, and the 3rd candle is bearish. it closes below the entire body of the 1st one. This candlestick pattern comes after an uptrend and puts the market down.
Bullish Kicker Strong Candlestick
It is a two-candlestick pattern. The 1st candle is bearish and downtrend, the 2nd candle has a gap up the opening from the 1st candle becomes irrelevant here. 2nd candle comes with a new and optimistic trend.
Bearish Kicker Candlestick Pattern
It is also two candlestick patterns. The 1st candle is bullish and uptrend, the 2nd candle has a gap down opening from the 1st one. These bearish and bullish kickers are an extremely strong pattern. They both come with a sudden change in market action.
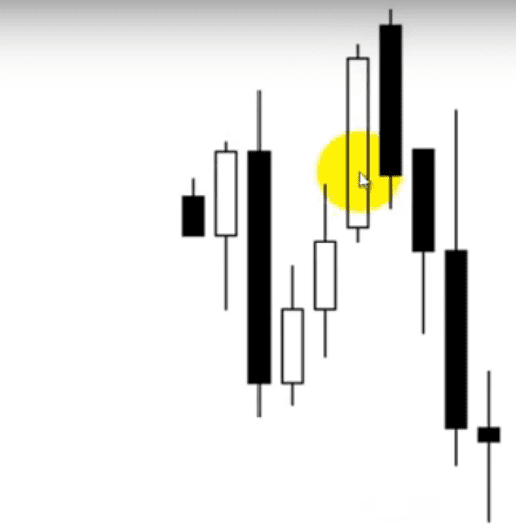
Bullish Harami Pattern
The word “harami” means pregnant, it is a Japanese word. In this pattern, the 1st candle is bigger and bearish. It appears after a downtrend. The 2nd candle has a small body and it is contained within the 1st candle.
Bearish Harami Pattern
These bullish and bearish Harami patterns are the most commonly found pattern in the candlestick chart pattern analysis. The 1st candle is bigger and bearish, and appears near the top, after an uptrend. The 2nd candle is a bearish candle and small body which is contained within the 1st candle.
The pattern indicates a decrease in momentum. Here a large candle is followed by a small candle showing opposite momentum indicating a loss of momentum of the trend. If a bearish candle is followed by a small bullish candle, as shown in the figure, it indicates a drop in downtrend momentum and the opposite signal occurs if reverse candles are formed. It is also seen as the start of a reversal of the trend if followed by other supporting signals.
Piercing Line Pattern
Here the 1st candle is bearish, the 2nd candle opens with a gap down but closes above the 1st candle midpoint. It predicts market optimism.
It is a bullish pattern. The first candlestick is a long bearish candlestick followed by a long bullish candle. The second candle or bullish candle opens lower than the low of the first bearish candle but closes above the halfway mark of the body of the first candle.
Dark Cloud Cover Pattern
It consists of two candles, the 1st one is the big and bullish candle and the 2nd candle opens with a gap but closes below the 1st candle’s midpoint. The market tends to go down here.
FAQs on Candlestick Chart Pattern Analysis
The Candlestick chart reflects market emotion visually through different shapes, colors, and sizes of candlesticks. Traders analyze the candlestick chart prior to making trading decisions. The regularly occurring chart patterns help to forecast the upcoming market price movement.
In a candlestick chart, each candlestick is made of open-high-low-close data (OHLC) of price. The chart consists of such multi-timeframe candlesticks. Candlestick pattern differs from one another. As per its pattern, color, and shape, there are many types of candlesticks where red candle means bearish, and green is bullish.
The bullish candle reflects the buyers’ demand is high and the bearish represents the sellers’ demand is more. In a bullish candle, the opening price starts from the down of the candle and the closing price up of the candle. On the other hand, the opposite happens in the bearish scenario.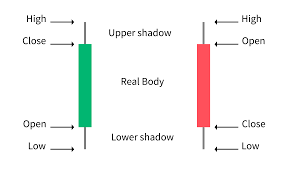
There are many candlesticks patterns present in the technical analysis. Among them, I will present the 5 best bullish candlestick patterns. These are the morning star, Bullish Engulfing, the piercing line, the Hammer, and Three White Soldiers.
Conclusion
We have discussed some of the basic and most powerful candlestick chart pattern analyses to predict market sentiments. Though no one can predict market turns consistently with the help of a candlestick chart, one can predict to some extent.
Candlestick chart pattern analysis can continue this discussion for pages because we can create many candlestick combinations that give different signals under different circumstances. There are also advanced candlestick patterns like Renko, Heiken Ashi, and such. But I would like to conclude here with a promise of coming back in the future with further discussion on candlesticks. Happy Trading!


MORNING STAR CANDLESTICK PATTERN
You made a mistake for above pattern there you write the pattern will go to down but it going up
Correct, we have made a small correction. Thanks for pointing out.