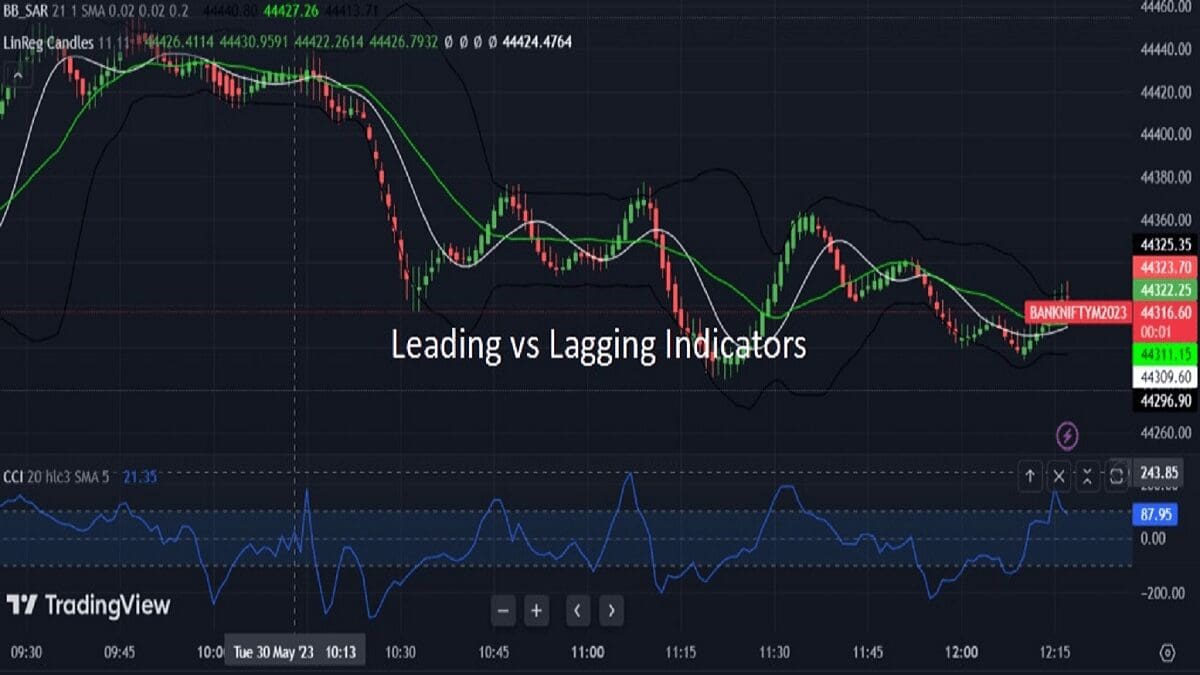
Master the Art of Price Action Trading with the Most Powerful Leading Indicator. Are you tired of lagging indicators that give you signals after the move has already happened? The Central Pivot Range (CPR) is different. It is a leading indicator that professionals use to predict market direction, identify precise support and resistance zones, and gauge market sentiment before the opening bell even rings.
Whether you trade Nifty, Bank Nifty, or stocks on Zerodha, Upstox, Fyers or TradingView, this guide will transform your trading. We will cover everything from the basic formula to advanced “Trap Zone” strategies used by institutional traders.
Many traders search for a central pivot range calculator or want to understand the CPR indicator formula before applying the central pivot range trading strategy on platforms like Zerodha or TradingView.
What is the Central Pivot Range (CPR)?
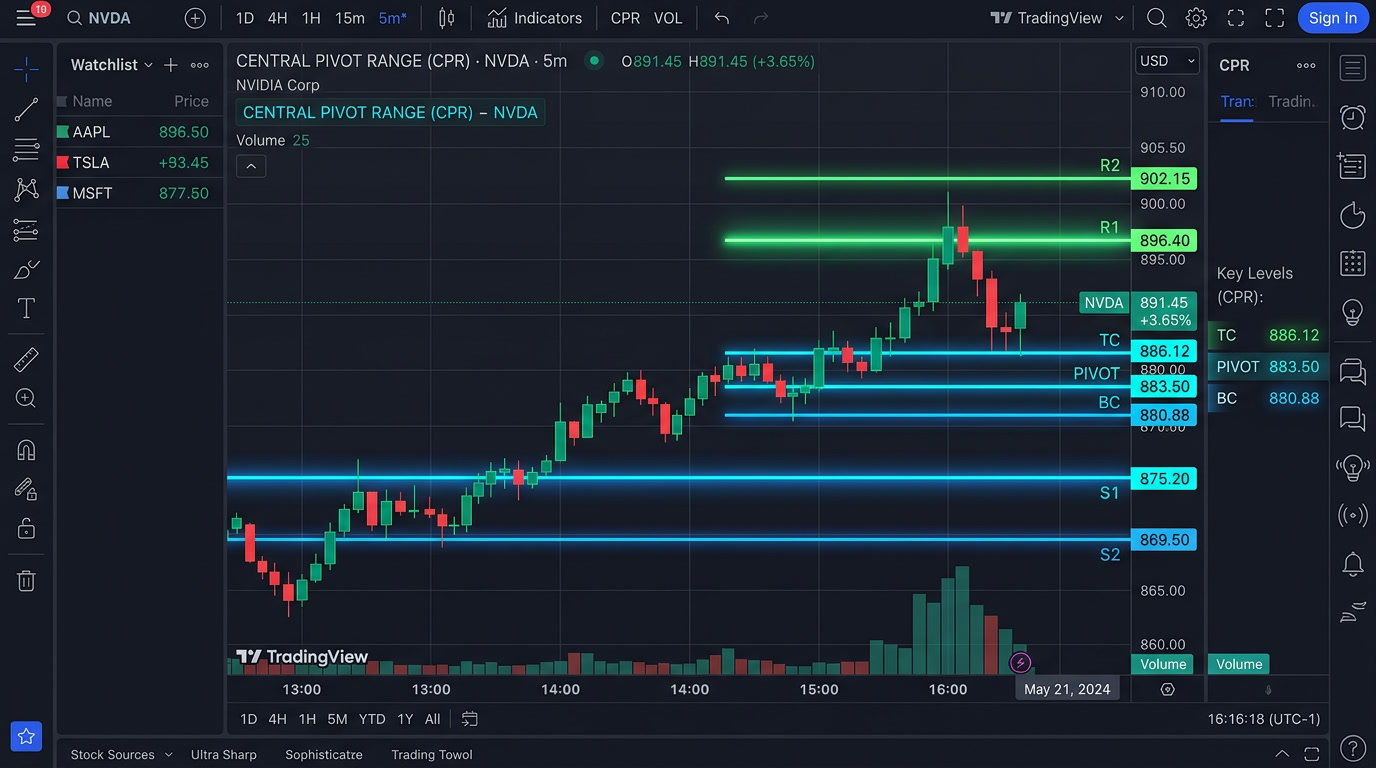
The Central Pivot Range (CPR) is a versatile technical indicator comprised of three price levels. Unlike standard pivot points that are single lines, the CPR creates a “zone” or “range” on your chart. This range acts as a major support or resistance barrier.
The three components are:
- TC (Top Central Pivot): The upper boundary of the range.
- Pivot (Central Pivot Point): The mid-point or anchor.
- BC (Bottom Central Pivot): The lower boundary of the range.
Think of the CPR as the “heartbeat” of the market. If the price is trading above the CPR, the sentiment is generally bullish. If it is trading below, the sentiment is bearish.
Who Invented the CPR Indicator?
The CPR was popularised by Frank Ochoa, a legendary trader and author of the book Secrets of a Pivot Boss. Ochoa, often called “PivotBoss,” introduced this concept to help traders move beyond simple support and resistance lines. He emphasised that the relationship between the Pivot, TC, and BC tells a story about market psychology that simple moving averages cannot.
CPR Formula & Calculation
Understanding the math helps you trust the lines on your screen. The CPR is calculated using the High (H), Low (L), and Close (C) of the previous trading session.
The CPR Formula:
1. Pivot (P) = (High + Low + Close) / 3
2. Bottom Central Pivot (BC) = (High + Low) / 2
3. Top Central Pivot (TC) = (Pivot - BC) + Pivot
Worked Example
Let’s calculate the CPR for Nifty 50 based on hypothetical previous-day data:






- High: 19,500
- Low: 19,300
- Close: 19,450
1: Calculate the Pivot
P = (19500 + 19300 + 19450) / 3 = 19,416.67
2: Calculate BC
BC = (19500 + 19300) / 2 = 19,400
3: Calculate TC
TC = (19416.67 – 19400) + 19416.67 = 19,433.34
Note: Depending on the calculation, TC can sometimes be lower than BC mathematically. However, on the chart, the highest value is always considered the Top Central (TC) and the lowest is the Bottom Central (BC).
How to Add CPR on Charts
In Zerodha Kite
- Open any chart (e.g., Nifty 50 Futures).
- Click on the Studies tab.
- Search for “Pivot Points“.
- In the settings for Pivot Points, look for the “Type” dropdown.
- Change “Standard” to “CPR“.
- Click Done. You will now see the three central lines.
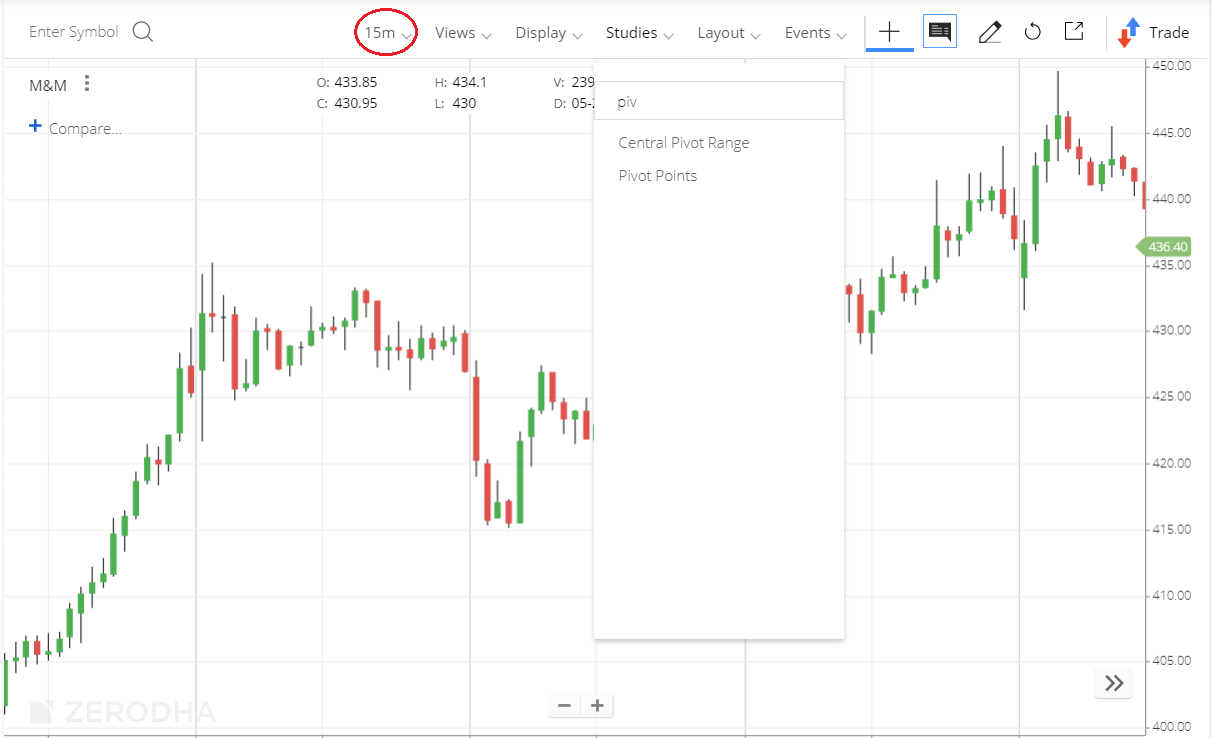
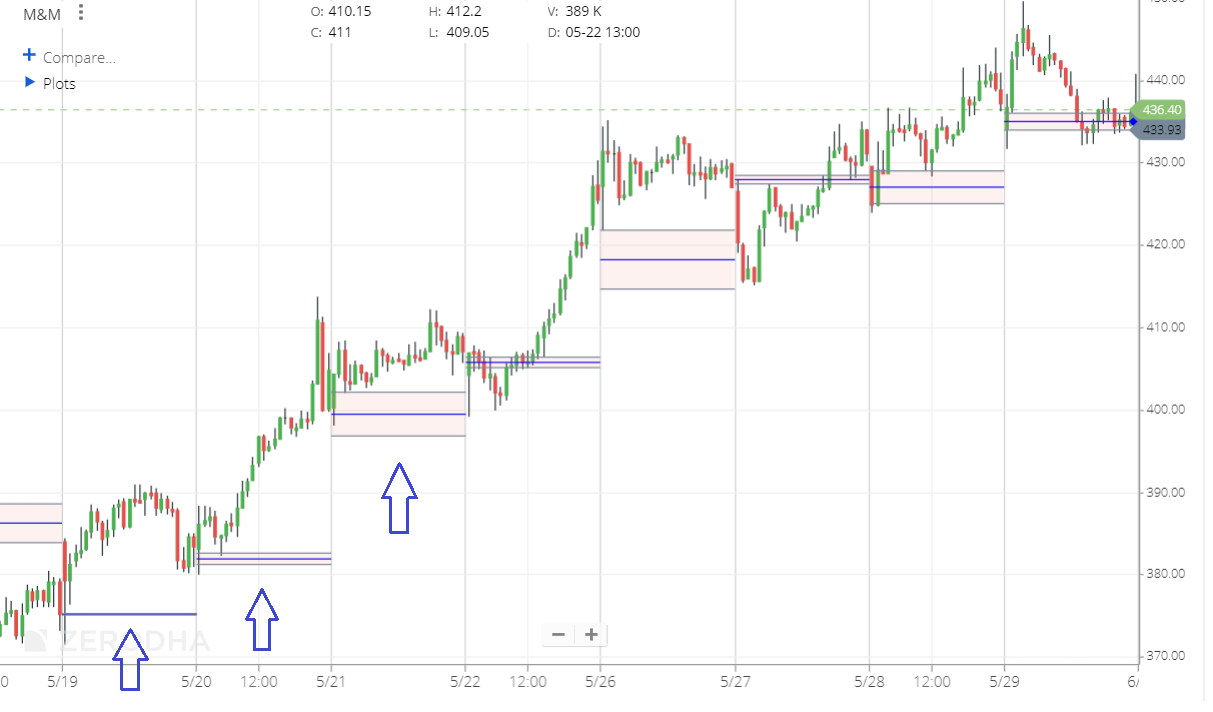
This is a 15-minute chart of M&M here. Once you load the CPR indicator, it loads as three horizontal lines, as seen below.
In TradingView
- Open your chart.
- Click on “Indicators” at the top.
- Search for “Central Pivot Range” or “CPR”.
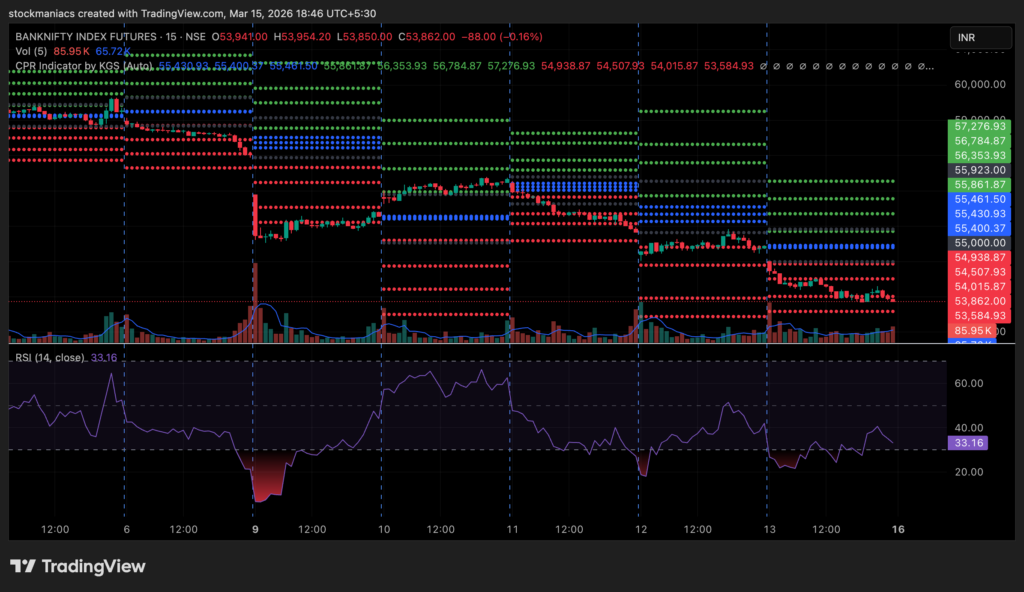
- Select a community script (Scripts by “KGS” or “Gomathi Shankar” are popular ones).
- Add it to the chart. You can customise colours in the settings menu.
CPR Width Analysis: Narrow vs. Wide
This is the most critical concept for intraday traders. The width of the CPR (distance between TC and BC) predicts the day’s volatility.
| CPR Type | Market Condition | Interpretation |
|---|---|---|
| Narrow CPR | Trending Day Likely | Market behaviour is standard. Use typical support and resistance strategies. |
| Wide CPR | Sideways Day Likely | The previous day was trending and volatile. The market is likely to rest or consolidate today. Avoid aggressive targets. |
| Average CPR | Normal Trading | Market behavior is standard. Use typical support and resistance strategies. |
Top 5 CPR Trading Strategies
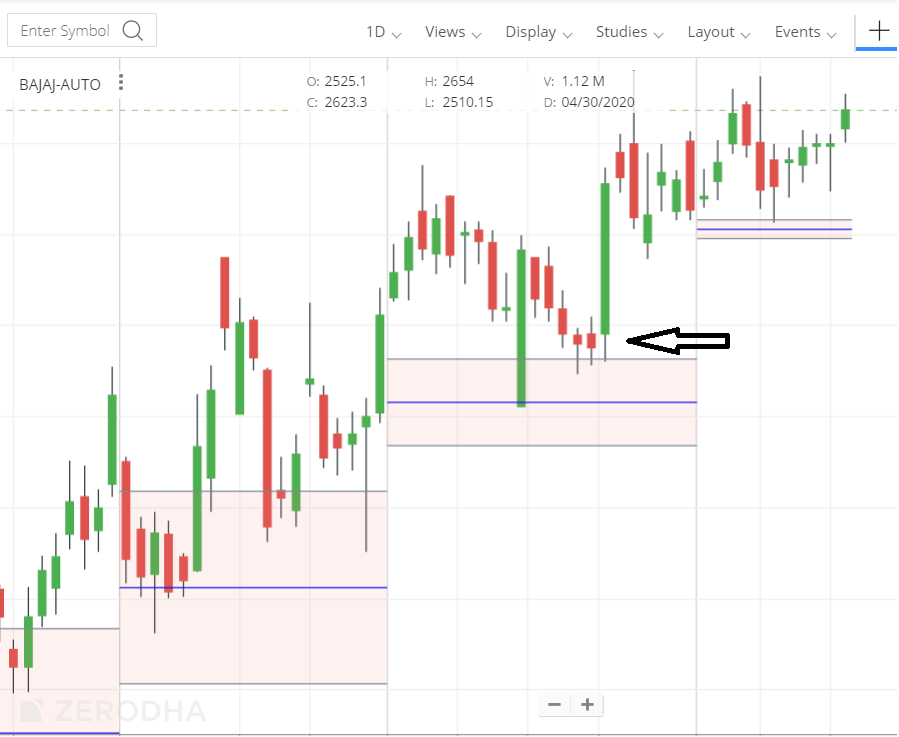
Strategy 1: The Bullish Outlook (TC Breakout)
When the stock price opens above the CPR and stays above it, the outlook is bullish. The CPR acts as a strong support zone.
- Entry: Look for a candle to close above the TC line. Alternatively, wait for the LTP to retrace back to the TC line and bounce.
- Stop Loss: Just below the Central Pivot or BC line.
- Target: The first resistance level (R1) or previous day’s high.
Strategy 2: The Bearish Outlook (BC Breakdown)
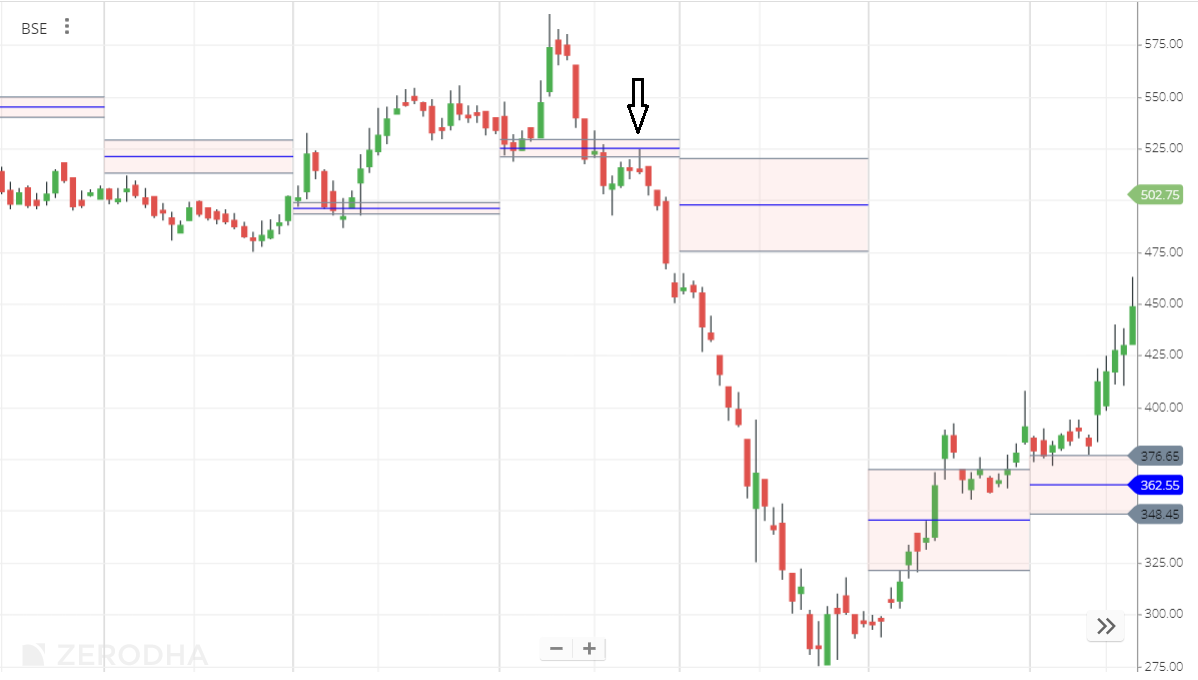
When the price opens below the CPR, the bears are in control. The CPR acts as resistance.
- Entry: Short sell when a candle closes below the BC line or rejects the BC line on a pullback.
- Stop Loss: Just above the Central Pivot.
- Target: The first support level (S1) or previous day’s low.
Strategy 3: Range Trading (Inside the CPR)
If the CPR is very wide, the price often gets stuck inside it. This is a “No Trading Zone” for trend traders, but scalpers can trade the range.
- Strategy: Buy at BC with a target of TC. Sell at TC with a target of BC.
- Warning: This is risky. It is often better to avoid trading when the price is stuck between TC and BC.
Strategy 4: Virgin CPR Strategy
A “Virgin CPR” occurs when the price does not touch the CPR levels for the entire day. This happens on strong trending days.
- Insight: A Virgin CPR from a previous day acts as a massive magnet and support/resistance level for future days.
- Trade: If price approaches a historical Virgin CPR level, expect a strong bounce or rejection on the first touch.
Strategy 5: The Trap Zone Breakout
The area between the Previous Day High (PDH) and R1 is often called a “Trap Zone.” Similarly, the area between the Previous Day Low (PDL) and S1 is a trap zone.
- Execution: If price breaks out of a narrow CPR and then clears the Trap Zone (goes above R1), it signals a high-momentum “Blue Sky” trade. Institutional buying is likely present.
Interactive Daily CPR Calculator
Use this tool to calculate tomorrow’s CPR levels. Simply enter today’s High, Low, and Close data.
CPR Success Rate & Statistics
Is CPR reliable? Data suggests yes. According to backtesting studies on index futures (like Bank Nifty):
- Win Rate: CPR strategies combined with price action have shown a win rate of approximately 58% to 65%.
- Narrow CPR Accuracy: Breakouts from a Narrow CPR have a higher probability of sustaining a trend (approx. 70%) compared to average width days.
- Profit Factor: Studies indicate a profit factor > 1.35, meaning the gross profit is significantly higher than gross loss over time.
Risk Management & Common Mistakes
Even the best indicator will fail without risk management. Here is how to protect your capital:
- The Stop Loss Rule: Never trade without a stop loss. If you buy at TC, your stop loss must be below the Central Pivot. If the candle closes below the Pivot, exit immediately.
- Avoid Wide CPR Breakouts: A common mistake is buying a breakout on a Wide CPR day. These breakouts often fail (fakeouts) because the market lacks energy.
- Don’t Ignore the Trend: CPR is powerful, but if the global market trend is heavily bearish, don’t blindly buy just because price is above TC. Look for context.
Trader Testimonials
“I struggled with finding support levels for years. Since switching to CPR, I don’t just see lines; I see the market’s value zones. The Narrow CPR breakout strategy alone recovered my previous losses.”– Rahul S., Intraday Trader, Mumbai
“The Virgin CPR concept is a game changer. It’s uncanny how price reacts to levels from 3 days ago exactly to the tick. Stockmaniacs’ guide helped me set this up correctly on Zerodha.”– Priya M., Derivatives Trader, Bangalore
Conclusion
The Central Pivot Range is more than just an indicator; it is a complete trading system. As an indicator it is leading, not a lagging one. By understanding the relationship between TC, Pivot, and BC, you can gauge market sentiment instantly. Remember the golden rule: Narrow CPR = prepare for a trend; Wide CPR = prepare for a range.
Ready to start? Open your charting platform now, add the CPR indicator using the settings above, and check tomorrow’s width. Your trading edge awaits.
Frequently Asked Questions (FAQs)
CPR works on all liquid assets, including high-volume stocks (like Reliance, HDFC Bank), high beta stocks, commodities, and forex. It is most effective where there is high institutional participation.
Yes. While daily CPR is for intraday, you can plot Weekly CPR (using last week’s High/Low/Close) for swing trading positions that last 3-5 days.
For intraday trading, the 5-minute chart is the gold standard. 15-minute charts are good for validating the trend, but entries are usually sharper on the 5-minute timeframe.
No. CPR is a static indicator. Once the day begins, the levels (TC, Pivot, BC) remain fixed for the entire day. They do not change with price movement.