If you’re new to the Indian stock market, you may be overwhelmed by the variety of trading strategies available to you. One strategy that has gained popularity in recent years is the RSI 2 strategy, developed by Larry Connors of TradingMarkets.com. In this guide, we’ll introduce you to the RSI 2 strategy. Let me explain how to use it, and provide some real-life examples to help you get started.
What is RSI 2?
Before we dive into the RSI 2 strategy, let’s first define what RSI 2 is. RSI stands for Relative Strength Index, which is a momentum oscillator that measures the speed and change of price movements. RSI 2 is a shorter-term version of the RSI that uses a two-period timeframe. This means it calculates the average gain and loss over the past two days.
To calculate RSI, you need to first calculate the average gain and loss over the past two days. Then, you can calculate the RSI value using the following formula:
- RSI = 100 – (100 / (1 + RS))
- where RS = Average Gain / Average Loss
RSI 2 is a shorter version of the RSI. Its values range from 0 to 100. Readings above 70 indicate overbought conditions and readings below 30 indicate oversold conditions.
The RSI 2 Strategy
The RSI 2 strategy is a simple but powerful trading strategy that involves buying stocks trading above the 200-day moving average when RSI 2 dips below either 10 or 5. The rationale behind the strategy is that when a stock is trading above the 200-day moving average, it’s considered to be in an uptrend. Similarly, when RSI 2 dips below 10 or 5, it’s considered oversold and due for a rebound.
To implement the RSI 2 strategy, follow these steps:


- Find stocks trading above the 200-day moving average: The 200-day moving average is a widely-used technical indicator that helps traders identify the overall trend of a stock.
- Check RSI 2 for Oversold Conditions: Once you have identified the stocks trading above their 200-day moving average, it’s time to check the RSI 2 indicator for oversold conditions. An RSI 2 reading below 10 or 5 indicates that the stock is oversold and could be due for a rebound.
- Buy the Stock: Buy the Stock When a stock meets both criteria of trading above the 200-day moving average and having an RSI 2 reading below 10 or 5, it’s time to buy the stock. The idea behind this strategy is to take advantage of oversold conditions in an up-trending stock and ride the rebound back up.
Real-Life Examples
Let’s take a look at some real-life examples to see how the RSI 2 strategy works in practice. We’ll be using the Nifty-50 stocks and Nifty and Bank Nifty indices for these examples, as they are the most widely-traded securities in the Indian stock market.
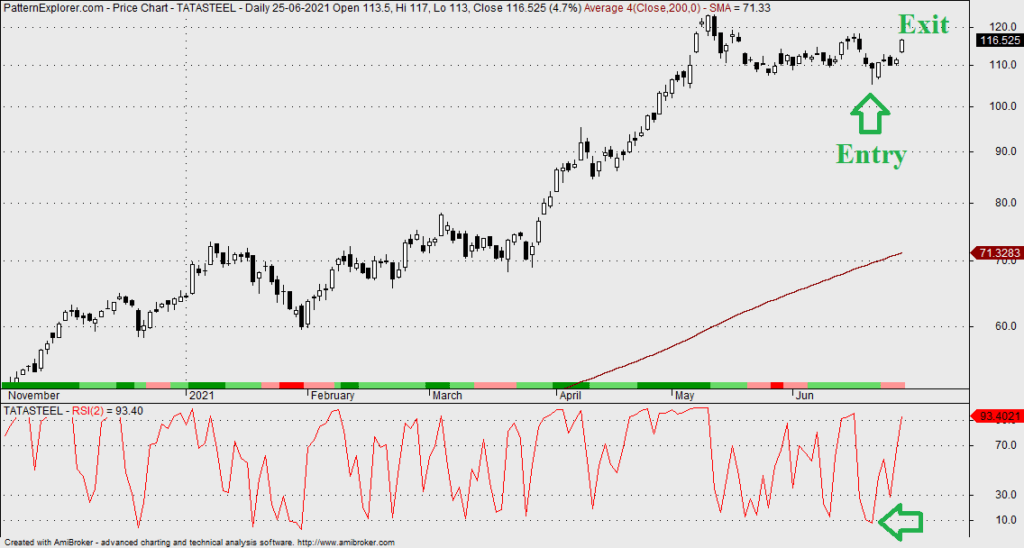
Example 1: Tata Steel Limited (TATASTEEL.NS)
On June 06, 2021, Tata Steel Limited (TATASTEEL.NS) was trading at ₹109.23 and had an RSI 2 reading of 7.60. The stock had been trading above its 200-day moving average for several months. Hence, this would have been a good entry point for the RSI 2 strategy, as the oversold condition indicated a potential rebound in the stock’s price.
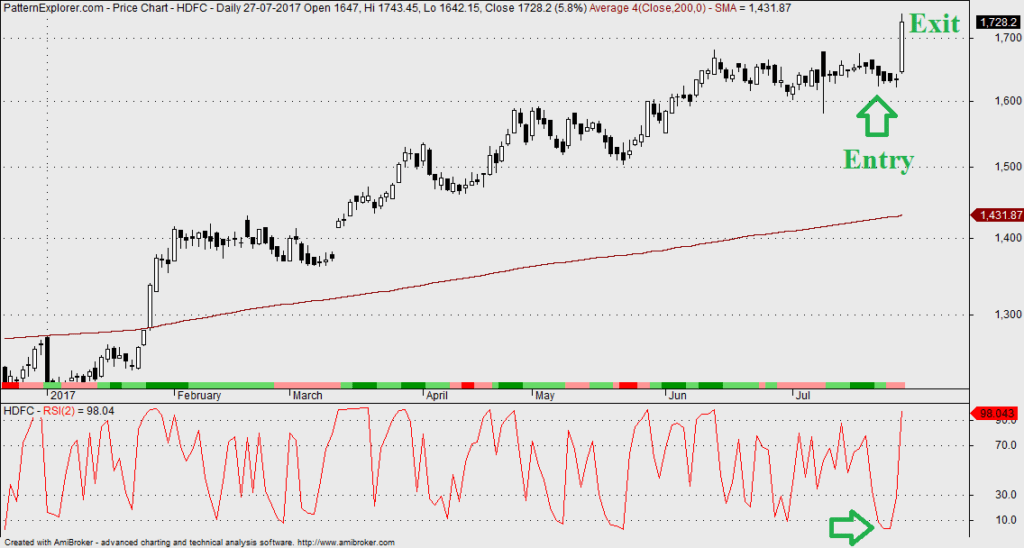
Example 2: Housing Development Finance Corporation Limited (HDFC.NS)
On July 07, 2017, Housing Development Finance Corporation Limited (HDFC.NS) was trading at ₹1,640.95. It had an RSI 2 reading of 8.51. The stock had been trading above its 200-day moving average for several months. This would have been a good entry point for the RSI 2 strategy. This is because the oversold condition indicated a potential rebound in the stock’s price.
Example 3: Nifty Index
For Nifty Index, I have made some tweaks to the RSI 2 strategy. I have seen that the Nifty index yields the best results when RSI crosses below 2 OR above 98. Those are extreme market conditions and the market is highly overbought or oversold.
On Friday, the 11th of August 2017, Nifty closed at 9710.80. The daily 2-period RSI has closed at 1.05. So it’s well below 2 and the market is highly oversold. On Monday morning open up a buy order on Nifty Future OR Nifty August 9700 call option. You can also place your buy order just before the market close on Friday itself.
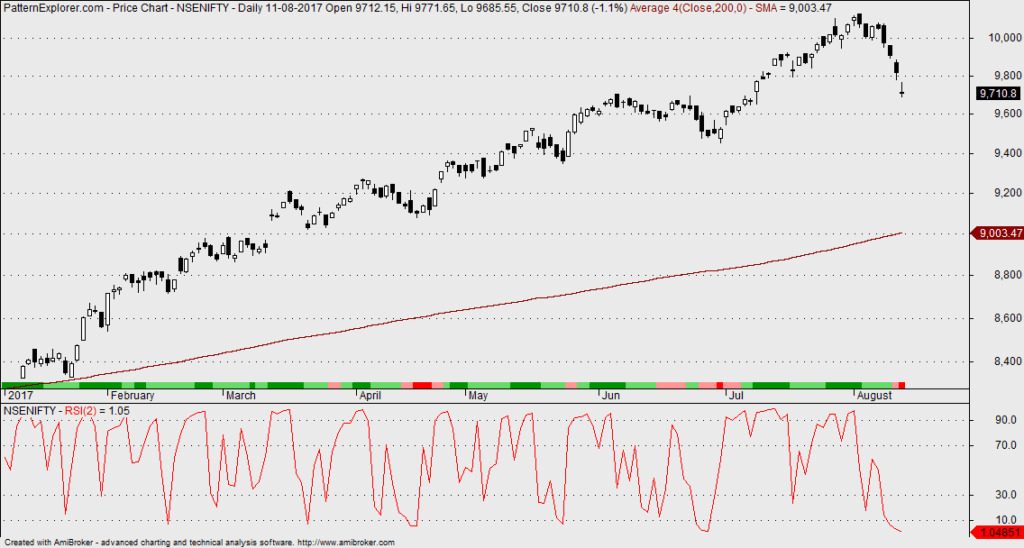
If the RSI 2 closes further below you can add to your Nifty future long OR Nifty August 9700 call option. Remember this is a positional trading system. You need to exit position at the end of the day when the 2-period RSI crosses above 60 or 70. Hence, no need to watch the charts the whole day. Just check the daily charts around 3:15 PM and take your exit decision. I exited my position here on the 16th of August 2017, as per RSI 2 strategy as the 2-period RSI has closed above 70.
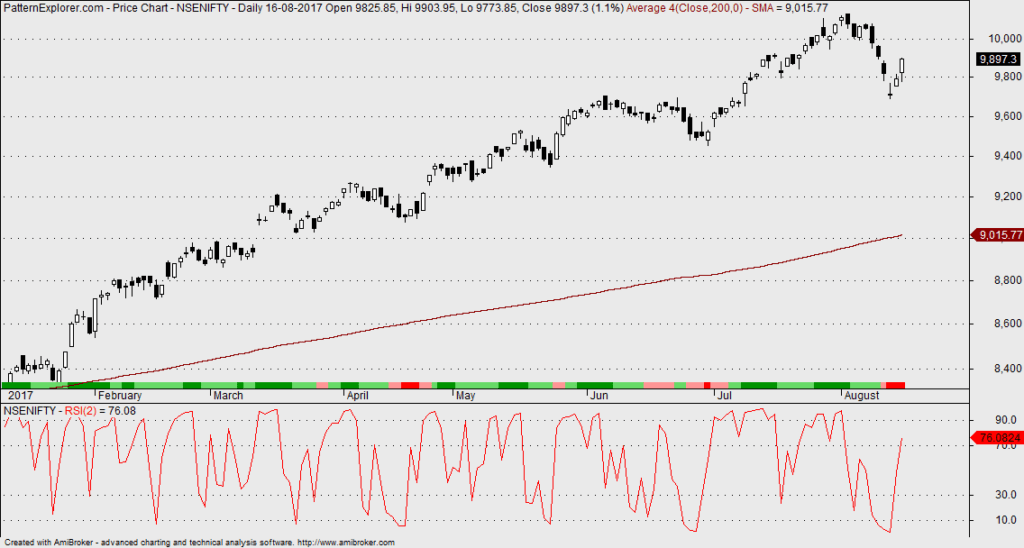
Nifty closed at 9897.30. Check the above image. So booked good profits. It’s a 187 points gain in only 2 days’ holding. This is the power of the RSI 2 Strategy.
FAQs
Here are some frequently asked questions about the RSI 2 strategy:
The RSI 2 is used to identify oversold and overbought conditions in stock. When the RSI 2 reading is below 10 or 5, it indicates an oversold condition. Similarly, when the reading is above 70, it indicates to square off any plus positions.
The best strategy for the RSI indicator depends on your trading style and goals. However, the RSI 2 strategy is a popular strategy that has been shown to be effective in identifying oversold conditions in an up-trending stock.
The RSI interval that is best depends on your trading style and goals. However, the RSI 2 interval is a shorter-term version of the RSI that has gained popularity in recent years, as it can provide quicker signals for oversold and overbought conditions. The traditional RSI interval is 14, but some traders use shorter or longer intervals depending on their preferences and the time frame of their trades.
No, the RSI 2 strategy may not be suitable for all traders, as it involves taking positions in individual stocks based on short-term oversold conditions. Traders should carefully evaluate their risk tolerance and trading goals before using any specific trading strategy. Additionally, it is important to always conduct thorough research and analysis before making any investment decisions.
Conclusion
In conclusion, the Relative Strength Index (RSI) is a popular technical indicator used by traders and investors to identify overbought and oversold conditions in the stock market. The RSI 2 strategy is a specific application of the RSI that has gained popularity among traders for its effectiveness in identifying oversold conditions in up-trending stocks.
The strategy involves finding stocks trading above their 200-day moving average and with an RSI 2 reading below 10 or 5, indicating oversold conditions. We can do this using stock screeners or manually checking price charts. Real-life examples of Nifty-50 stocks and the Nifty index demonstrate how the RSI 2 strategy can be implemented in practice. However, it’s important to note that no strategy is foolproof and that investors should always do their own research and exercise caution when investing in the stock market.


Hi sir,
Can u describe how to set 2 – period RSI in kite. When I selected period as 2 in period it is showing RSI as 43. So please explain
Suri at my end 2-period RSI is close to 40 now as the market has already taken a bounce as expected. For next long entries please buy around 3:15 PM – 3:30 PM when you see daily RSI 2 is below 2. The stock/index should be well above 200-day moving average.
Sir, as per this strategy bank nifty aug future RSI is around 2.5. Can we intiate trade in this?
I feel your readings are wrong. I am getting Bank Nifty spot daily 2-period RSI value as 43.61.
Sorry again sir if I am bothering you but I want to get this right. I am following these chart specifications
1. Time scale – 30 mins
2. Style – heikin ashi
With these I am getting 2.85. So please can u mention chart specifications
Entered nifty yesterday based on this strategy. Thanks fr sharing ur knowledge
Dhanka, hopefully, you are now making some serious money 🙂
Is there any scanner/ screener in zerodha or fox trader to scan stocks to trade larry connor’s strategy.
Sir, will u please create screener for this strategy in chartink.com.
thanking you
Raja
Ok let me check.