
Introduction to Near-Breakout Stocks
If you’re new to investing, you’ve probably heard the term “breakout stocks.” Simply put, breakout stocks are those whose prices suddenly jump past a resistance level, signalling potential for significant gains. But have you heard about “near breakout stocks”? These are stocks that are just about to cross a crucial price level. For new Indian investors, understanding this concept can lead to profitable opportunities. Think of this like catching a cricket ball before it crosses the boundary—timing matters!
What Does ‘Near Breakout’ Mean?
In easy terms, a “breakout” occurs when a stock price moves beyond a key resistance area—imagine traffic suddenly clearing after a long jam. A “near breakout” means the stock is approaching this critical point but hasn’t crossed yet. It’s like waiting at a red light, ready to zoom off when it turns green. Identifying near breakout points helps you enter trades early, minimising risks and maximising potential rewards.
Why Should New Investors Care About Near-Breakout Stocks?
Investing in near-breakout stocks has two big advantages. Firstly, you stand a chance of quick gains if the stock does break out. Secondly, buying early means you avoid chasing prices upward after everyone else jumps in. For instance, if you spot Infosys nearing a breakout and invest early, you might profit more than someone entering later, after the price spikes.
How to Identify Near-Breakout Stocks in India
Recognising Key Support and Resistance Levels
Support and resistance are like floors and ceilings for stock prices. Support is the price where buying interest is strong, preventing further falls, while resistance is where selling pressure stops the price from rising further. Look at charts from platforms like TradingView India or Moneycontrol to spot these levels.
Watching for High Volume
Volume, the number of shares traded, is crucial. If you see volume suddenly increase as a stock price nears a resistance level, it indicates strong investor interest. Recently, IRFC showed significant volume before breaking out, signalling its readiness to rise.
Using Technical Indicators
Technical indicators simplify identifying potential breakouts:
- Moving Averages (MA): These show average stock prices over time, helping spot trends. For instance, a stock crossing its 50-day Moving Average upward could signal a breakout.
- Relative Strength Index (RSI): RSI shows if a stock is overbought or oversold. Values of RSI between 60-70 suggest potential upward momentum.
- Bollinger Bands: These indicate price volatility. Narrow bands followed by a price surge often predict breakouts.
Tools and Platforms to Find Near-Breakout Stocks
Using stock screeners like Screener.in, Tickertape, or Chartink simplifies identifying potential breakout stocks. These tools let you filter stocks by price movements, volume spikes, and technical indicators. Additionally, setting alerts on apps like Zerodha Kite or Groww helps you get notified when stocks approach critical levels.


A Simple Scan to Find Near-Breakout Stocks
I have created a scan to spot the stocks before they break out. You can use the scan in the Chartink scanner of your favourite screening tool.
latest max ( 10 , latest high ) > latest max ( 252 , latest high ) * 0.95 and latest max ( 10 , latest high ) < latest max ( 252 , latest high ) and latest max ( 10 , latest high ) < latest max ( 252 , latest high ) * 1.0
Real-Life Examples of Indian Near-Breakout Stocks
Recent Stocks Near Breakout
| Stock | CMP (₹) | Sector | Breakout Status |
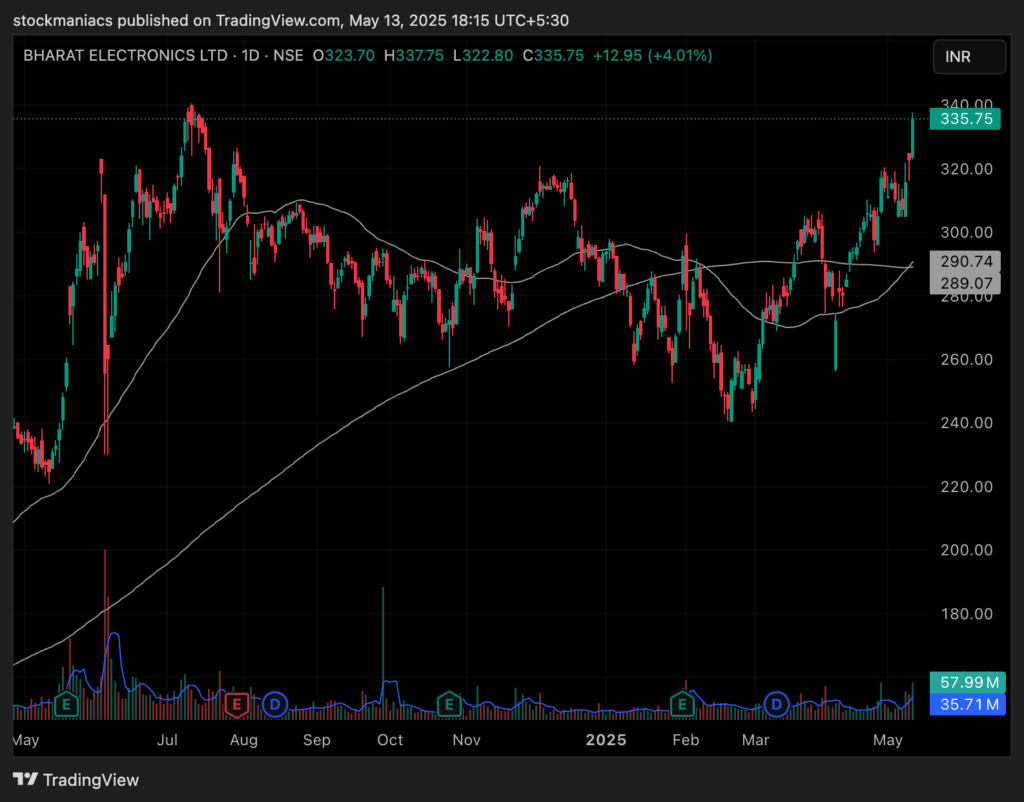
| BEL | 335.75 | Aerospace & Defence | Near Breakout |
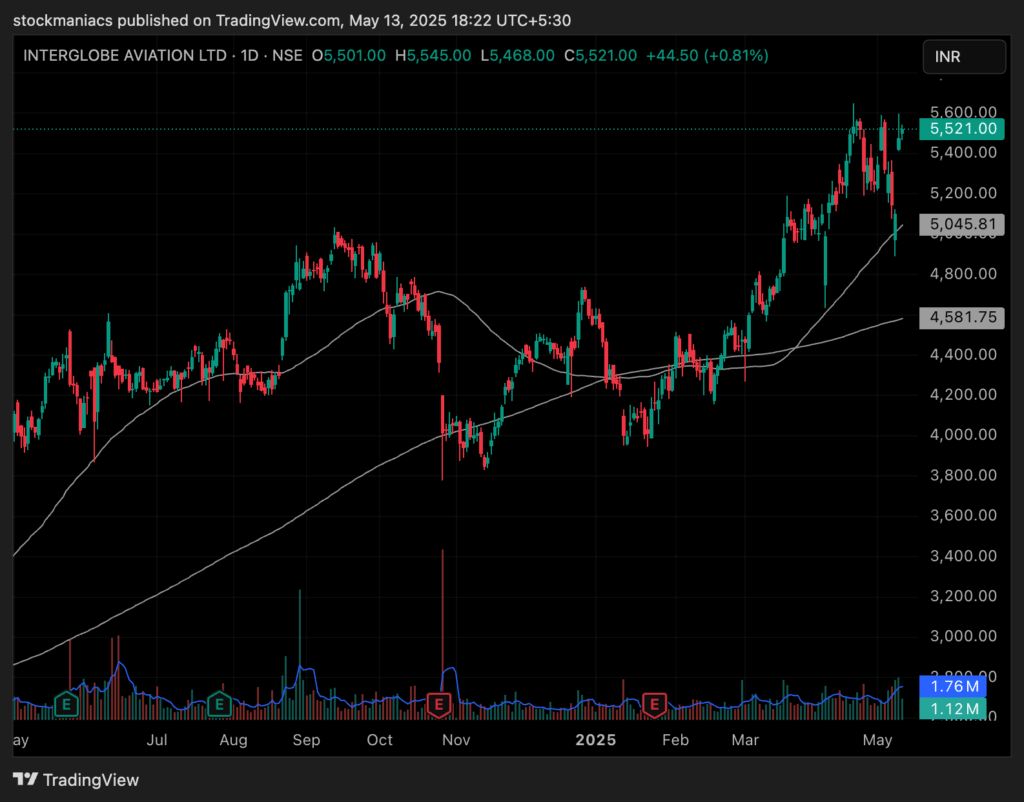
| INDIGO | 5521 | Services | Near Breakout |
| JKCEMENT | 5200 | Industrials | Near Breakout |
| MRF | 140425 | Auto | Near Breakout |
| AIIL | 1935.50 | Finance | Near Breakout |
In-Depth Case Study: Bharat Electronics Ltd (BEL)
The chart for Bharat Electronics Ltd (BEL) indicates a robust bullish breakout with a decisive candle closing near its high at ₹335.75, representing a substantial gain of 4.01%. The price has convincingly broken above the previous resistance level around ₹320, marking a clear bullish sentiment and suggesting strong upward momentum. Supported by increased trading volume, this breakout signals a potential continuation of the upward trend. Furthermore, the stock is trading comfortably above both its short-term and long-term moving averages, indicating strength and stability in the ongoing rally. Investors may look for further price action confirmation and possible retests of the breakout zone before making aggressive bullish entries.
In-Depth Case Study: InterGlobe Aviation Ltd (IndiGo)
The chart for InterGlobe Aviation Ltd (IndiGo) shows a strong uptrend, with the stock currently trading at ₹5,521.00, reflecting a moderate gain of 0.81% in the latest session. The price is well above both its 50-day and 200-day moving averages, indicating sustained bullish momentum. The recent price action has seen the stock break through the critical ₹5,500 resistance level, suggesting a potential continuation of the long-term uptrend. However, the presence of high trading volume spikes around recent peaks indicates potential profit-taking, which could lead to short-term volatility. Traders should watch for a possible retest of the breakout zone around ₹5,500 as a support level before confirming further upside.
Quick Snapshots: 3 More Indian Stocks
- JK Cement Ltd: Near breakout above ₹5323, showing strong buying signals.
- MRF Ltd: Approaching breakout above ₹140650, driven by high volumes.
- Authum Investment & Infrastructure Ltd: Near ₹1988, the 52-week high, exhibiting a bullish chart pattern.
Common Patterns That Signal a Breakout is Near
Watch for chart patterns like triangles, flags, or wedges. These patterns represent stock prices consolidating before making a decisive move. For instance, a triangle pattern shows prices narrowing until a breakout occurs. Identifying these visually on Indian stock charts can boost your success rate.
Role of Fundamentals in Breakout Opportunities
Strong fundamentals often underpin sustainable breakouts. If a company reports excellent earnings, launches new products, or sees high FII/DII investments, the chances of a real breakout increase significantly. For example, Tata Motors recently saw increased institutional buying, pushing its price above a key resistance level.
How to Avoid False Breakouts
False breakouts happen when prices briefly cross resistance but quickly fall back. Watch for:
- Lack of significant volume increase
- Prices are not holding above resistance levels at closing
- Sudden reversal of technical indicators
Always confirm breakouts with solid volume and sustained price levels. Set a stop-loss just below your buying price to minimise losses if the breakout fails.
Step-by-Step Guide: Making Your First Near-Breakout Trade
Follow this beginner-friendly checklist:
- Identify a stock nearing resistance with good volume.
- Decide your entry price slightly above resistance to confirm the breakout.
- Place a stop-loss to limit risks.
- Monitor closely post-entry; adjust your stop-loss if the price moves favourably.
- Book partial profits as the price rises to secure gains.
Practice on virtual trading platforms before committing real money.
FAQs About Near-Breakout Stocks in India
A near breakout stock is a stock that is trading just below a significant resistance level, indicating it might soon break out into a strong upward trend if buying pressure continues. These stocks often show signs of building momentum, making them attractive for early entries.
Yes, breakout stocks can be risky if not managed properly. While early entries can offer high returns, false breakouts are common, leading to sharp reversals if the breakout fails to hold. Using tight stop-losses can help manage this risk.
Chartink.com is one of the best free tools for screening breakout stocks in the Indian market. It offers powerful filters, financial data, and customizable scans, making it ideal for retail investors.
Moving averages, like the 50-day or 200-day, are ideal for beginners as they smooth out price action and clearly show the direction of the trend. They also act as dynamic support and resistance levels.
Yes, breakouts can fail, often resulting in a rapid price reversal. It’s essential to confirm a breakout with strong volume and a solid close above the resistance level to reduce the risk of a false breakout.
Final Thoughts and Next Steps
Breakout investing can significantly enhance your stock market journey. Start small, follow disciplined trading habits, and always keep learning. Why not spot your first near-breakout stock today?
Happy investing!


