Coppock Curve Indicator: Calculation & Strategy

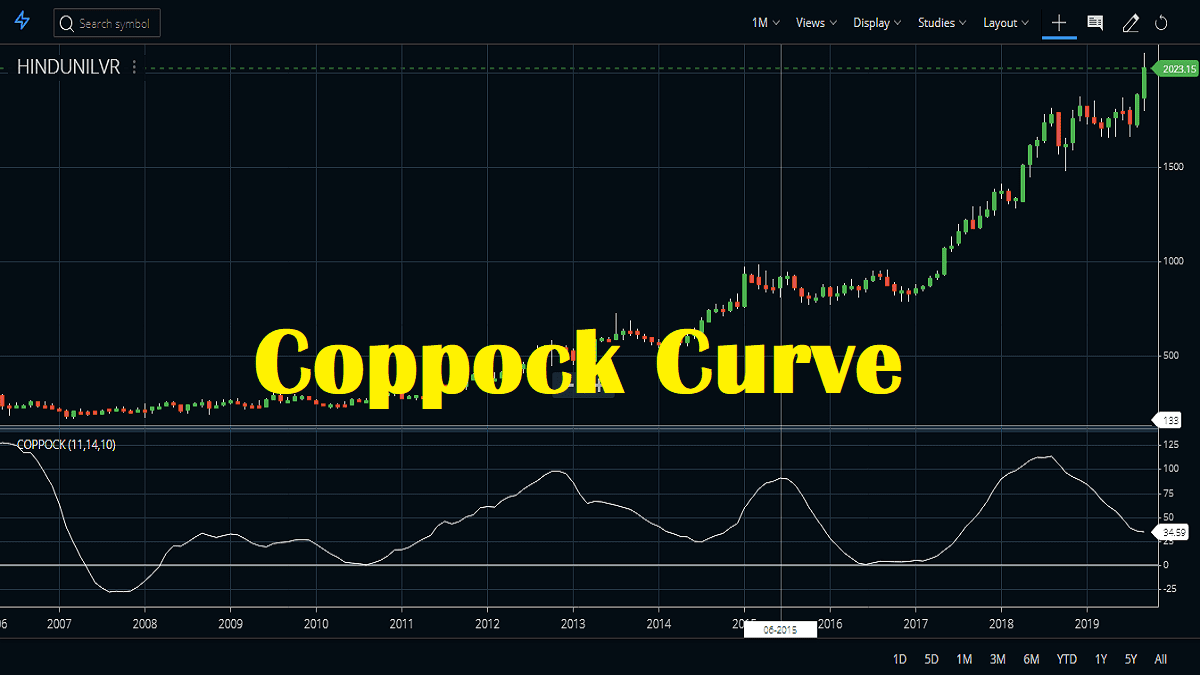
The Coppock Curve indicator was introduced by E.S. Coppock in 1965. He designed the indicator to help longtime investors in the market. Primarily he used the indicator for a monthly timescale and used it to create buy opportunities. This is actually an oscillator, that oscillates above or below a zero line. How to Read Coppock … Read more

Commodity Channel Index: CCI Indicator Strategy

Commodity Channel Index

The Commodity Channel Index indicator (CCI) was introduced by Donal Lambert. CCI measures the variationsย in the price of a stock with respect to its statistical mean. Contrary to the meaning derived from its name, the CCI works well with any stock or index. High values of CCI show that the stock price is high compared … Read more

Choppiness Index Indicator Trading Strategies

Choppiness Index Indicator

The Choppiness Index Indicator (CHOP), as the name suggests, was introduced to determine whether the market is choppy. That means it shows whether the market is range bound or whether the market is trending. It also shows the market is following a particular trend in either direction. What is the Choppiness Index indicator? Bill Dreiss, … Read more

Chande Momentum Oscillator Formula, Strategy

Chande momentum oscillator

Chandeย Momentum Oscillator (CMO) was introduced by Tushar Chande who also invented the forecast version of the oscillator. He has created the oscillator by calculating the difference between the sum of all recent gains and that of all recent losses over a particular period of time. Then he divided the result by the sum of all … Read more

Chande Forecast Oscillator Formula, Strategy

Chande forecast osccillator

Chandeย Forecast Oscillator (CFO) was developed by Tushar Chande. This oscillator can be said to be an extension of linear regression-based indicators. This oscillator plots the difference between the closing price of the stock and the linear regression-based price forecast over a specific period of time. We can attach this indicator very easily to the Zerodha … Read more

Chaikin Volatility Indicator Formula and Strategy

Chaikin Volatility Index

Chaikin Volatility Indicator or CVI was developed by Marc Chaikin. He also has developed the Chaikin Money Flow or CMF indicator. Volatility is depicted by the indicator because it calculates the difference between the high and low for every period or candle. Some Common FAQ Chaikin Volatility Indicator Formula This indicator is a volatility indicator … Read more

How to Use Chaikin Money Flow or CMF Indicator?

Chaikin money flow

Chaikin Money Flow (CMF indicator) is an indicator of technical analysis that is used to measure the volume of Money Flow over a specific period of time. This actually tracks the mone flow volume made by institutions. Money Flow Volume, a concept created by Marc Chaikin who also introduced the accumulation distribution line, quantifies the buying and selling … Read more

All About Center of Gravity Indicator (COG)

Center of Gravity Indicator

The Center of Gravity indicator or also known as COG is actually an oscillator with almost zero lag. John F Ehlers introduced this COG indicator in 2002. It is a modern oscillator. The COG indicator is an oscillator that is smoothed to prevent undesirable whipsaws. We can characterize the center of Gravity by the following … Read more

Bollinger Bandwidth Technical Indicator, Strategy

We have already learned about the usage of the mother indicator Bollinger Bands. In this post, we will discuss Bollinger Bandwidth (BBW), which is aย technicalย analysis indicator derived from the standard Bollinger bands. BBW measures the percentage difference between upper and lower bands. Features of the Bollinger Bandwidth Indicator The BBW uses all standard features of … Read more

Bollinger Percent B Indicator (Bollinger %B)

Bollinger %B Indicator

If you are already trading with the Bollinger Bands indicator you will find that the Bollinger Percent B indicator is just the same. The only difference is that the Bollinger %B Indicator gives you a precise number by which you can identify the relationship between the price and the bands. What is the Bollinger %B … Read more

๐ŸŸฃ Zerodha Best Overall ๐ŸŸข FYERS Best Charts ๐Ÿ”ต Upstox Beginner Friendly