Elder Ray Index Indicator Formula and Settings
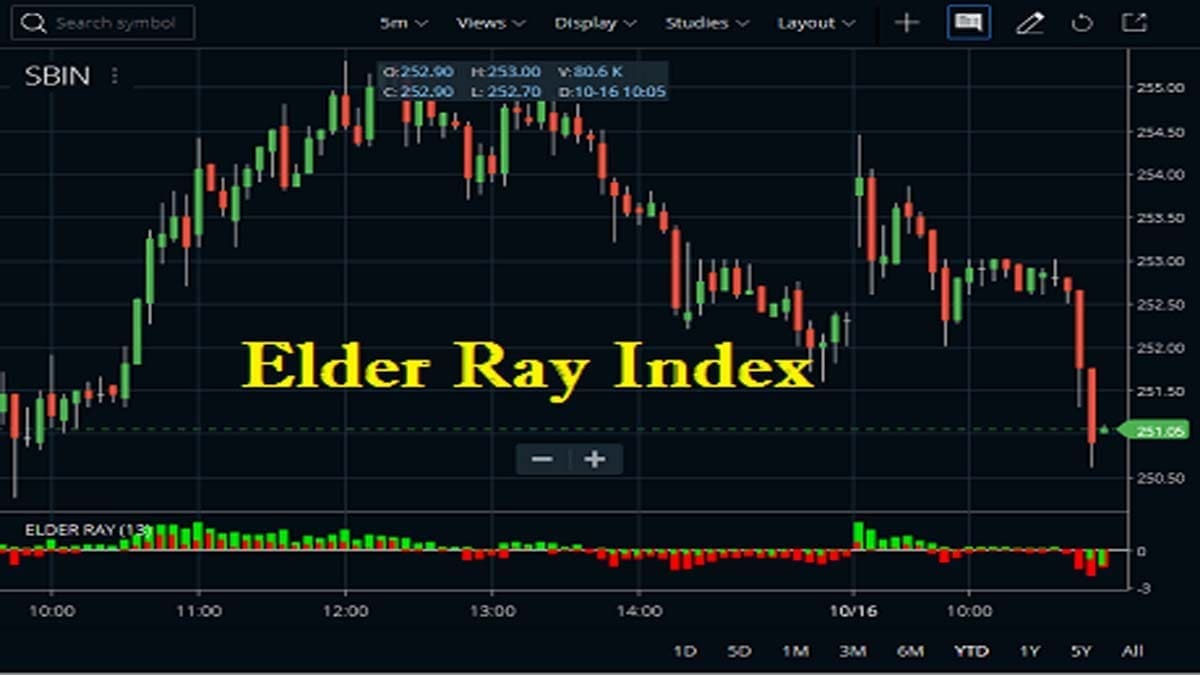
Elder Ray Index Indicator in Zerodha Kite

Once again, theΒ Elder-Ray IndexΒ is an indicator developed by Alexander Elder. It measures the amount of buying and selling pressure in the market.Β The components of the Elder Ray Index indicator are “bull power” or “bear power”. The main part of this indicator is an exponential moving average, which is a trend-following indicator essential to the calculation. … Read more

How to Trade the Elder Impulse System Indicator?

Elder Impulse System Indicator

After Force Index and Fisher Transform the Elder Impulse System indicator was also developed and described by Alexander Elder in his books. It’s based on two popular indicators – a 13-period Exponential Moving Average (EMA) and a histogram MACD. The Elder Impulse System uses the Ema indicator for defining a short-term trend and the MACD-Histogram measures momentum. This … Read more

Elder Force Index Indicator Usage Guide

Elder Force Index Indicator

The Elder Force Index is an indicator that uses price and volume to assess the power of a move or vary in turning points. It is developed by the veteran trader Alexander Elder. It was introduced inΒ Alexander Elder’s classic book, Trading for a Living: Psychology, Trading Tactics, Money Management (Wiley Finance). The Force Index has … Read more

Ehler Fisher Transform Indicator Formula, Strategy

Ehler Fisher Transform Indicator

Ehler Fisher Transform indicator is designed to clearly spot major price reversals and visualize them. It is also a leading/lagging indicator of all the indicators present in Zerodha Kite. This is reflected in spots where the rate of change is the biggest. It is an indicator built on an oscillator that was developed by John Ehler, the … Read more

Ease of Movement Indicator Formula, Strategy

Ease of Movement Indicator in Zerodha Kite

The Ease of Movement indicator or EMV is a volume-based oscillator that fluctuates above and below the zero lines. This indicator is designed to measure the “ease” of price movement. Richard Arms created EquivolumeΒ charts to visually display price ranges and volume. It takes Equivolume to the next step by quantifying the price/volume relationship and showing … Read more

Donchian Width Indicator Strategy, Formula, Usage

Donchian Channel Width

We have already discussed the DC or Donchian Channel indicator in our last post. The next indicator that is available in Zerodha Kite and other major trading platforms is the Donchian Width indicator (DW). It’s a less known and less used indicator but Zerodha has cleverly introduced this in their new Kite interface. How To … Read more

Donchian Channel Indicator: Learn How to Trade it

The Donchian Channel indicator was developed by Richard Donchian. It is a technical momentum pointer that calculates the higher highs and lower lows of a specific period of time forming a channel around those values with upper and lower bands. When the traders use this indicator, generally 20-period highs and lows are considered. Also, a … Read more

How to Trade the Disparity Index Indicator?

Disparity Index

The Disparity Index indicator is a technical momentum indicator that compares the current market price with the moving average of price over a particular time period. This is calculated for a specific time period. Thus, we can easily identify the current price trend with respect to the moving average of a longer time period. Β Steve … Read more

Detrended Price Oscillator (DPO) Usage Guide

Detrended Price Oscillator

As the name implies, the Detrended Price Oscillator (DPO) attempts to eliminate the trends in price through the plotting chart. DPO is based on the fundamental idea that long-term price cycles are made up of short-term cycles. Identifying these short-term components of long-term cycles will be able to help us in finding the major turning … Read more

Darvas Box Indicator and Formula, Strategy

Darvas Box Indicator

Darvas Box indicator is a great technical analysis tool that was introduced by Nicholas Darvas in the 1950s. He was a dancer who made $2,000,000 within a period of 18 months, trading in the market while on a global dance tour using this theory. He has actually this amount of money from just $36000. This … Read more

Correlation Coefficient Indicator Formula, Example

Statistically speaking, we say two sets of data or two variables as correlated if there exists a statistical relationship (linear interdependence) between them. If two data sets or variables have a strong statistical relationship between them, we identify them as highly correlated. The Correlation Coefficient summarizes these two data sets into a single number between +1 … Read more

🟣 Zerodha Best Overall 🟒 FYERS Best Charts πŸ”΅ Upstox Beginner Friendly