
Introduction
In my previous post on Quandl (now Nasdaq Data Link) linking with AmiBroker, I discussed how to download free end-of-day data for Amibroker. In this post, we will discuss how to download Quandl stock data and use it to create an Excel stock research system quickly.
Download Quandl Excel Add-In
The first step is to go to the Quandl site and create a free account. Next, visit the Quandl Excel Add-In page by clicking HERE. Download and install the Excel add-in that matches your Excel version (32 vs 64 bit). If needed, download and install Visual C Redistributable from THIS LINK. Verify 10.0.50903 version is installed (to check that it is installed properly).
Obtain Quandl API Key
Now, visit the Quandl API page by clicking HERE. Scroll to the bottom of the page where it says “Sign Up Now For A Free API Key”. Click SIGN UP.
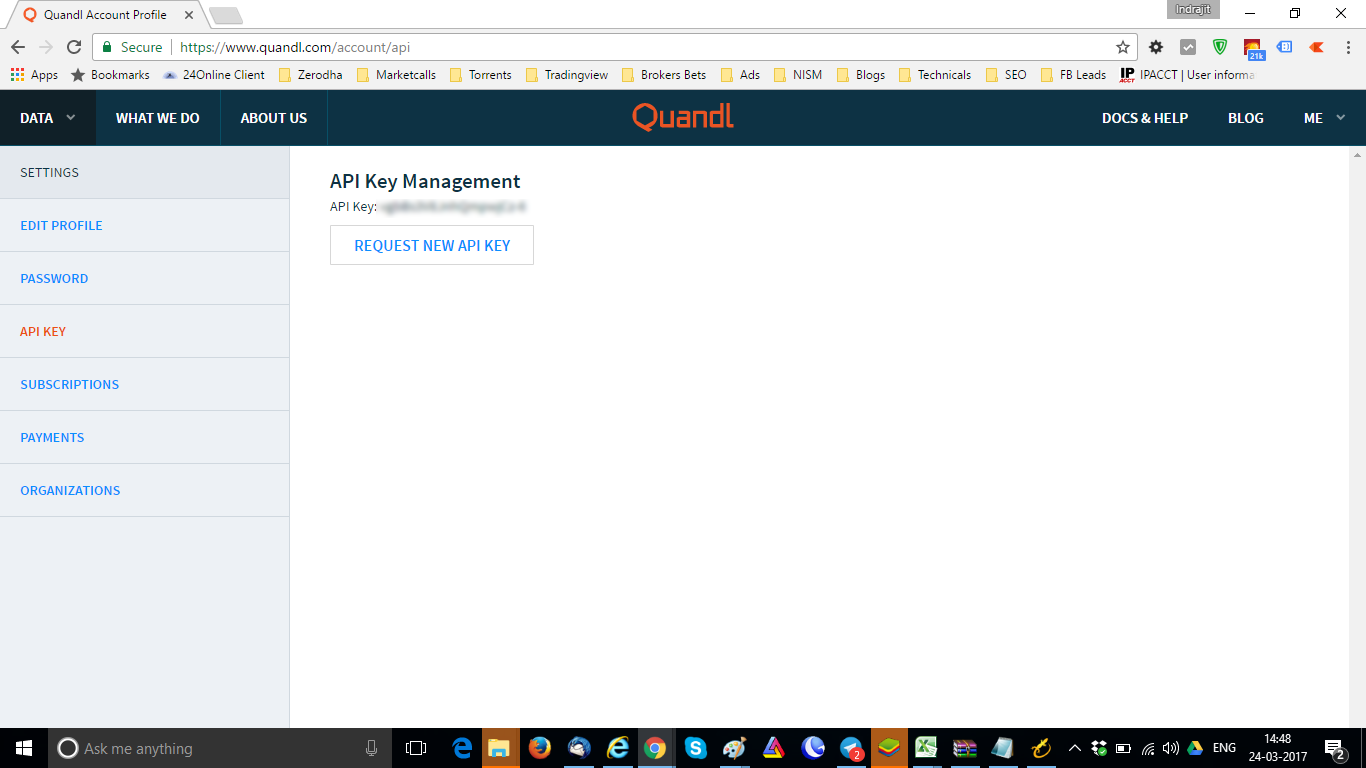
Create a new account OR sign in with your existing Quandl account. Go to your account profile and note your Quandl API key.
Load Quandl Add-In in Excel for Stock Research
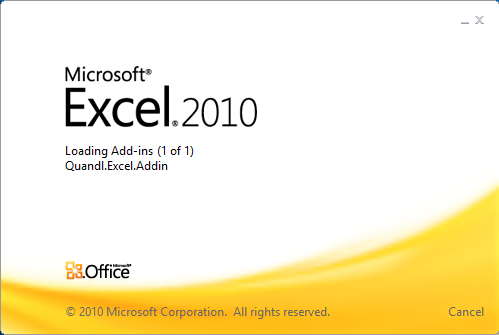
Launch Microsoft Excel. It will show that the Quandl add-in is being loaded.
Once Excel is running, you can see a new tab appearing in your Excel sheet called “Quandl”. Click that tab. You will be able to see tabs “Get Data”, “Refresh Sheet”, “Refresh Workbook”, “Stop”, “Formulas”, “Settings”, “About” and “Check Update.”






Input Quandl API Key
Click on “Settings.” Input your API key here as shown below and click “Save.”

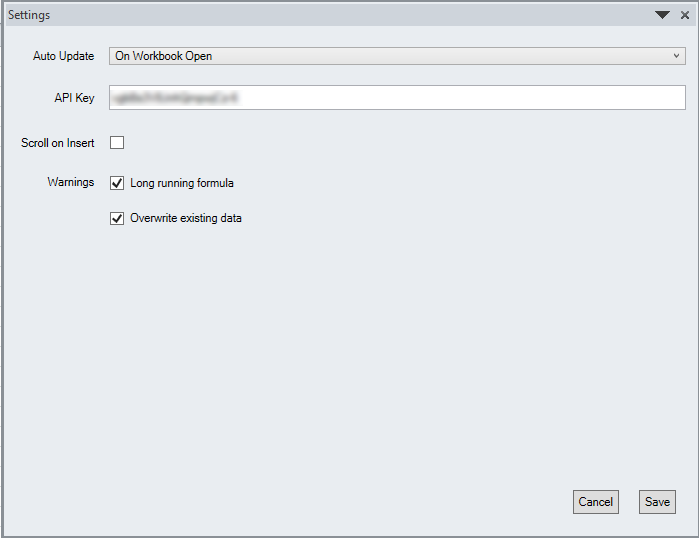
Now, your Excel is ready to import Quandl stock data.
Import Quandl Stock Data
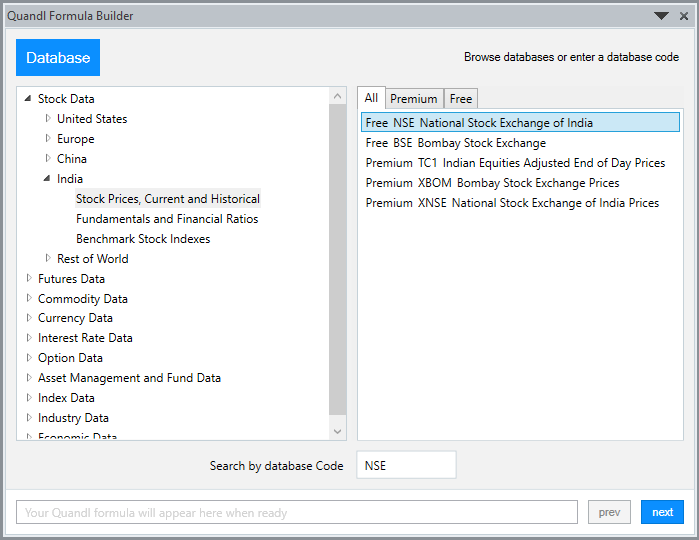
We will import sample stock data so that you can do your Excel stock research. We will download RELIANCE symbol data. Click on the “Get Data” tab. Click “Stock Data” → “India” → “Stock Prices, Current and Historical“. On the right pane, select “Free NSE National Stock Exchange India.” Click “Next.”
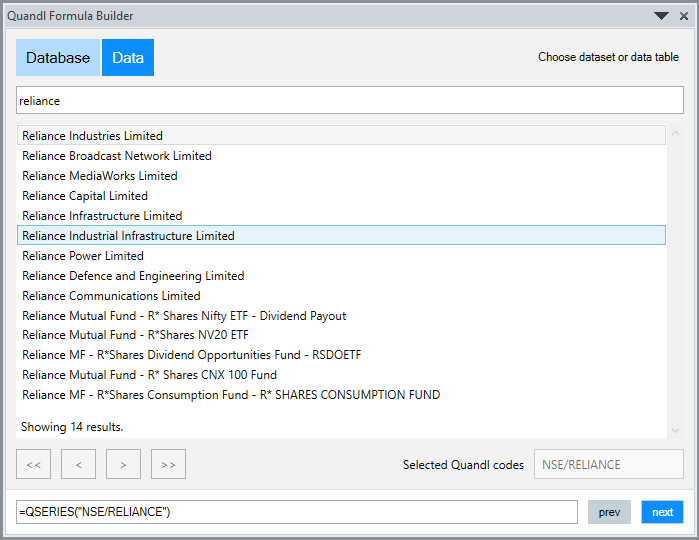
Now, you can see all the symbol names. Select “RELIANCE INDUSTRIES LIMITED,” and click “Next.”
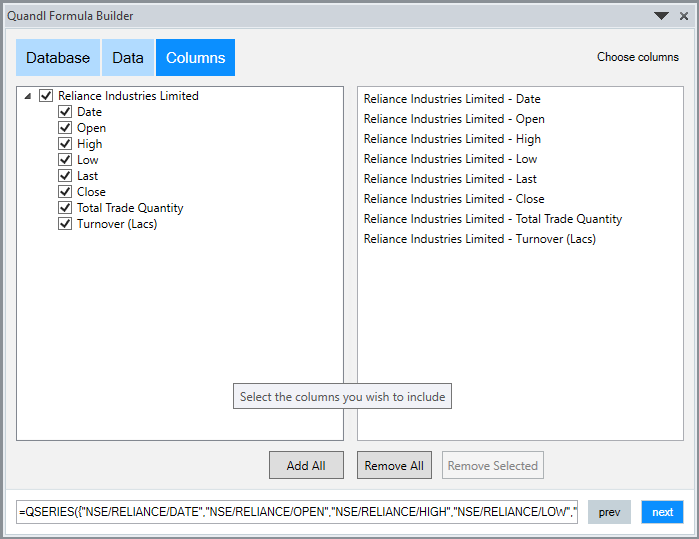
Choose the data fields that you want to import. Available fields are Date, Open, High, Low, Close, Total Traded Quantity, and Turnover (Lacs). Click “Next.”
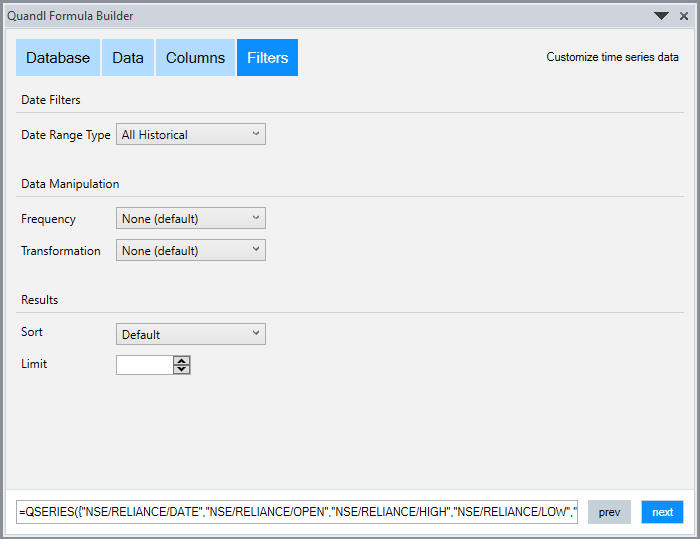
Select DATE RANGE, select DATA MANIPULATION FREQUENCY, etc., and click “Next.” Select to include headers and dates. Click “Insert.”
Research Quandl Stock Data in Excel
Now, RELIANCE symbol data will be imported into your Excel as shown below.
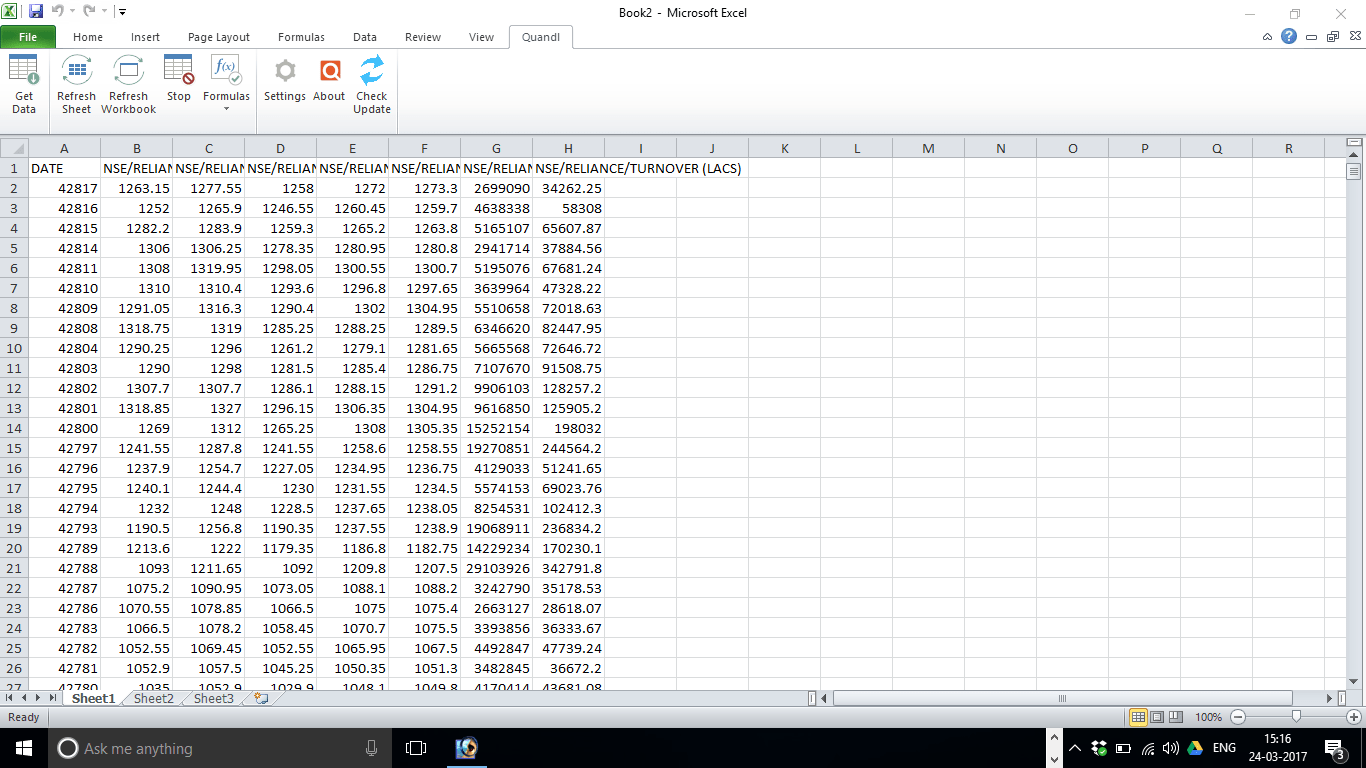
You can use this Quandl stock data to perform your Excel stock research OR build a trading system easily.
FAQ
Quandl offers both free and paid data. The availability of free data varies by dataset and provider, and some datasets may have limitations on usage or access. You can sign up for a free account to access Quandl’s free datasets or purchase a subscription for their premium datasets.
Quandl aggregates data from a variety of sources, including financial and economic databases, central banks, and individual contributors. Some of their data providers include the Federal Reserve, World Bank, and the United Nations.
Quandl codes, also known as “Quandl codes” or “Quandl tickers,” are used to identify individual datasets on the Quandl platform. You can find Quandl codes by searching for a specific dataset on the Quandl website or by browsing their database. Quandl codes typically consist of a combination of letters and numbers.
Yes, Nasdaq acquired Quandl in 2018. Quandl operates as a standalone business unit within Nasdaq and continues to offer its data services to customers.
Conclusion
Quandl is an excellent resource for obtaining stock data, and using it to perform analysis in Excel is a powerful tool for investors. If you have any questions or comments, feel free to leave them in the comment section below.

How to add Technical Analysis formulae in excel to filter stocks?
Thanks in advance and Cheers.
The Pi to Excel connection not working
Soumendra, please check Zerodha Pi to Excel connection post for that.