
We call this intraday stock scanner the NSE Stock Screener India. The screener pulls live data from the market and will show you results on Nifty 50 stocks. This will also produce trading opportunities in front of you as per our pre-defined logic. Check this page after 09:25 AM – 09:30 AM for updated results.
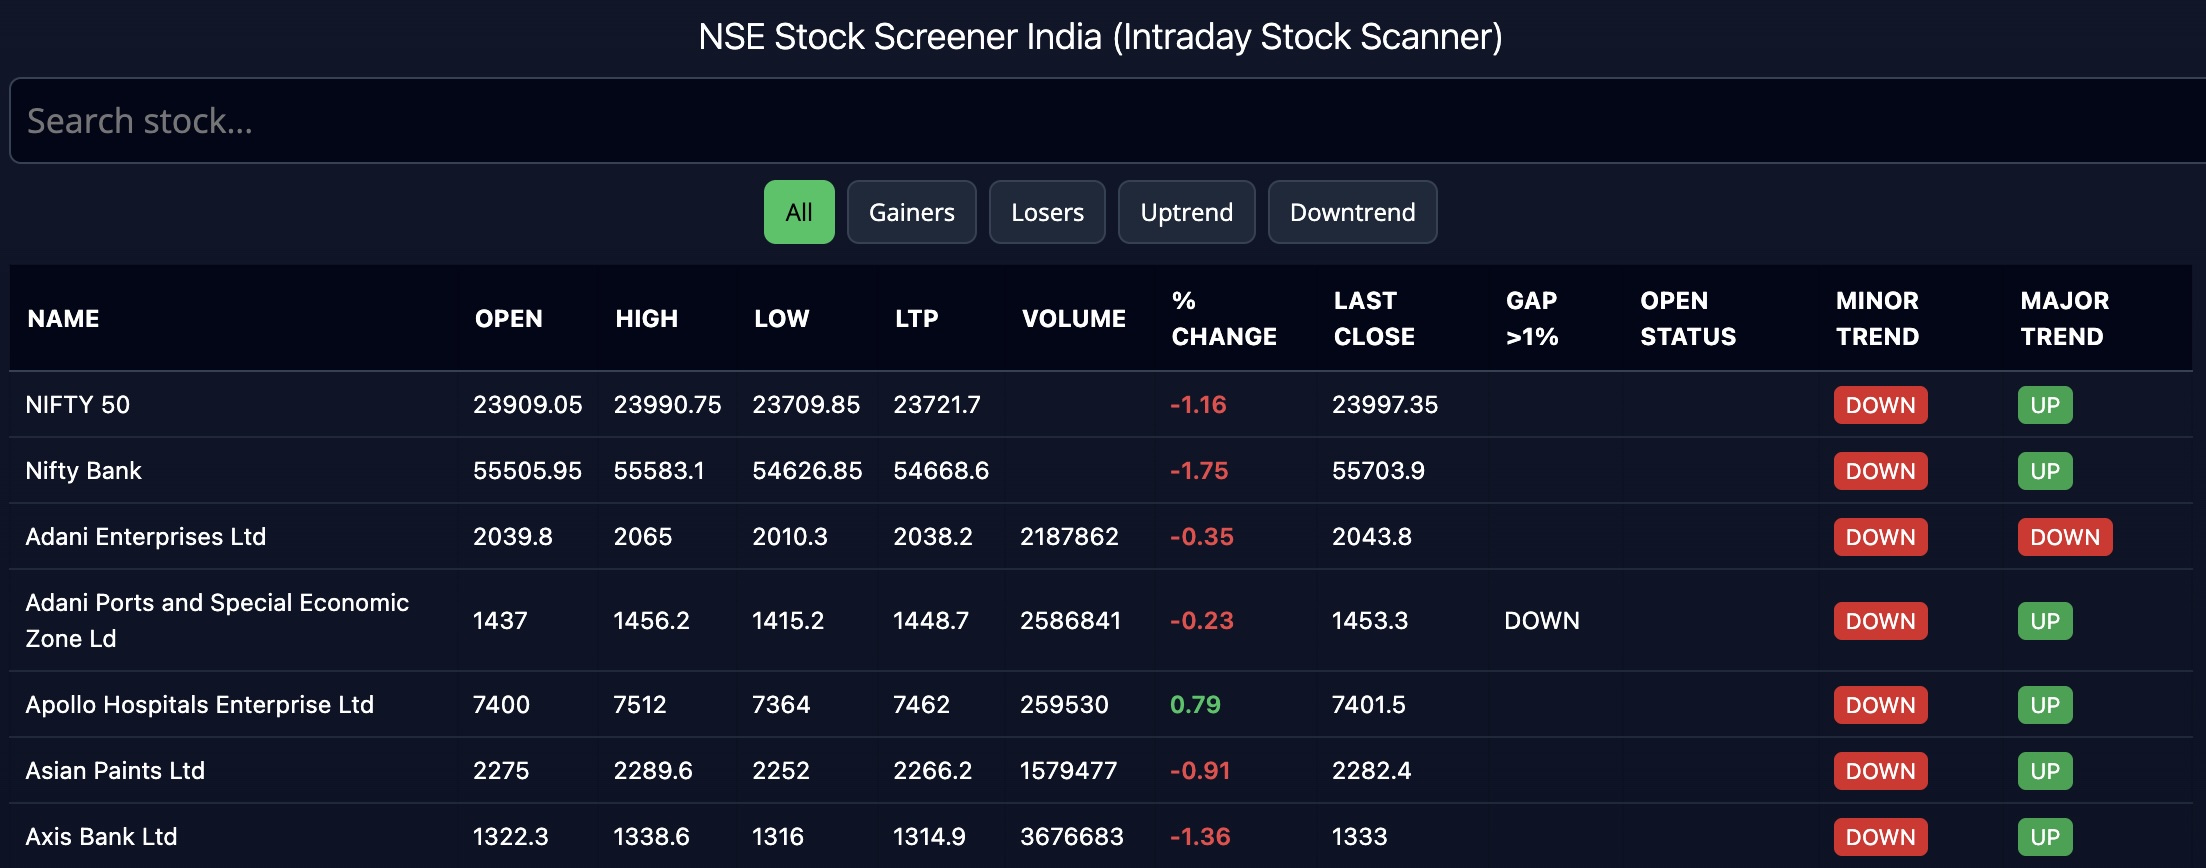
NSE Stock Screener India (Intraday Stock Scanner)
| NAME | OPEN | HIGH | LOW | LTP | VOLUME | % CHANGE | LAST CLOSE | GAP >1% | OPEN STATUS | MINOR TREND | MAJOR TREND |
|---|
Intraday Stock Scanner FAQ
A stock screener is a tool that scans and lists stocks with pre-defined logic. As an example, we can create a scanner with a logic where the 5-day simple moving average crossed the 20-day simple moving average. If we run this scan this will list all stocks that meet this criterion. This tool can scan for day trading as well as delivery trading. Our NSE Stock Screener India will work for intraday screening.
We can create a screening tool on some platforms that can calculate data based on logic. Excel is a nice tool for that. We can create a screening tool on charting platforms like AmiBroker, Metastock or ChartInk, etc.
There are many screening sites or web pages available. You can also create a positional or intraday stock scanner on charting platforms. In fact, a popular search term is stock screener moneycontrol. So people visit the Moneycontrol site to see their screening page. Forget all those complex scanners. Use our NSE Stock Screener India; we have given some simple logic to it, and this can find some accurate trade ideas for you.
How to interpret the columns of NSE Stock Screener India?
For a long time, we were thinking of building a technical stock screening tool for our visitors. Our concept of the screening tool was that it should be free, it should be simple, and it should be easy to use. So finally we managed to build a simple and easy-to-use NSE Stock Screener India for our site.
The columns in our Intraday Stock Scanner
The screener has the following columns in it. Name of stock/index, then open, high, low, last traded price, volume and percentage change in the current trading session. From the next column, the trading logics are placed. The next 2 columns are very important. The 8th will show the previous day’s close. The 9th column will screen if any stock/index has made more than a 1% gap on either side, which will produce a nice gap trading strategy. Gaps also often denote trend days in the stock market.
Column number 10 will screen if OPEN = LOW or OPEN = HIGH. This open high low same strategy also gives big money-making trades within a short span of time, right after the opening of the market.
Column 11 will screen the stock’s short-term trend. This can be matched with the O=L or O=H strategy. If the short-term trend is UP and the stock’s open status is O = L, then the chance of the stock moving higher in intraday is much higher. Similarly, if the stock’s short-term trend is DOWN and the stock’s open status is O=H, then the chance of the stock moving downwards in intraday is much higher. Column 12 or the last column will simply print the long-term trend of the stock.
Columns 11 and 12 in our stock screener can be used in correlation. If the long-term trend is UP, fresh positional long can be taken when the short-term trend also changes to UP from DOWN. Similarly, if the long-term trend is DOWN, a fresh positional short can be taken when the short-term trend also changes to DOWN from UP.
Example of trading using the NSE Stock Screener India
Using the Open High Low Same Strategy in our intraday stock scanner
This screening tool can be used very easily. Let us give some live examples. On Friday, the 15th of November 2019, the intraday stock scanner has shown BPCL has Open = High. So, where it opened (Rs. 513.95), it marked the high of the day at the opening price. This is a short-selling opportunity as per the open-high-low same trading strategy. So we have gone short in the stock after 10-15 minutes of trade. Our stop loss was opening high, ie, at 513.95. The shorting level was around 512.


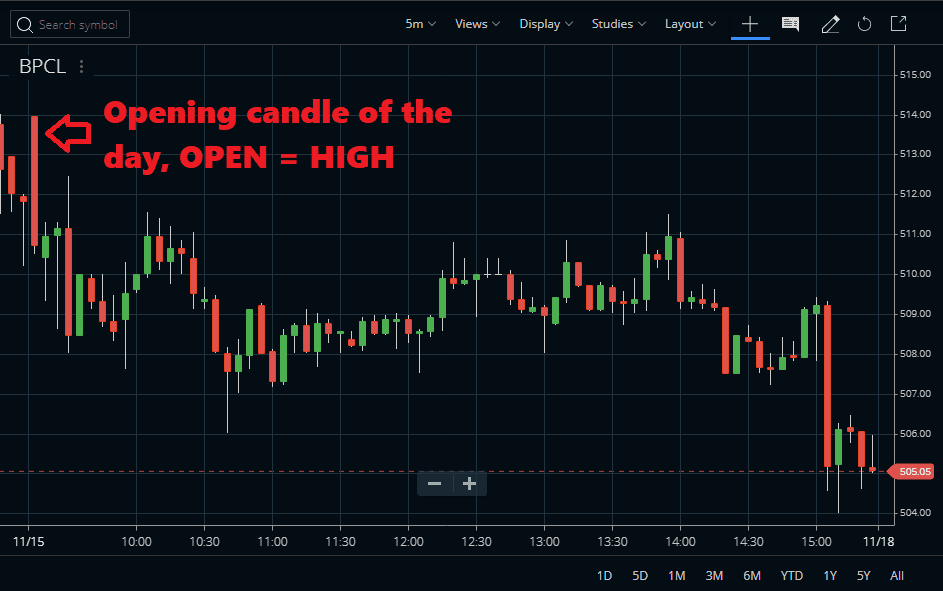
BPCL share price could not sustain the higher levels and corrected in intraday trades and finally closed at Rs. 505.05. This was a decent profit opportunity for anyone who followed our NSE stock screener in India.
Using the Gap Trading Strategy in the NSE Stock Screener India
On the other hand, our intraday stock scanner has identified that Bharti Airtel and Infratel stocks have opened gap down, with the gap size is greater than 1%. So there was another trading opportunity. If these stocks fill the gap, traders are going to make 1% profits for the day. Exactly that has happened. Both stocks have filled the gaps, providing good profits for the followers of the page.
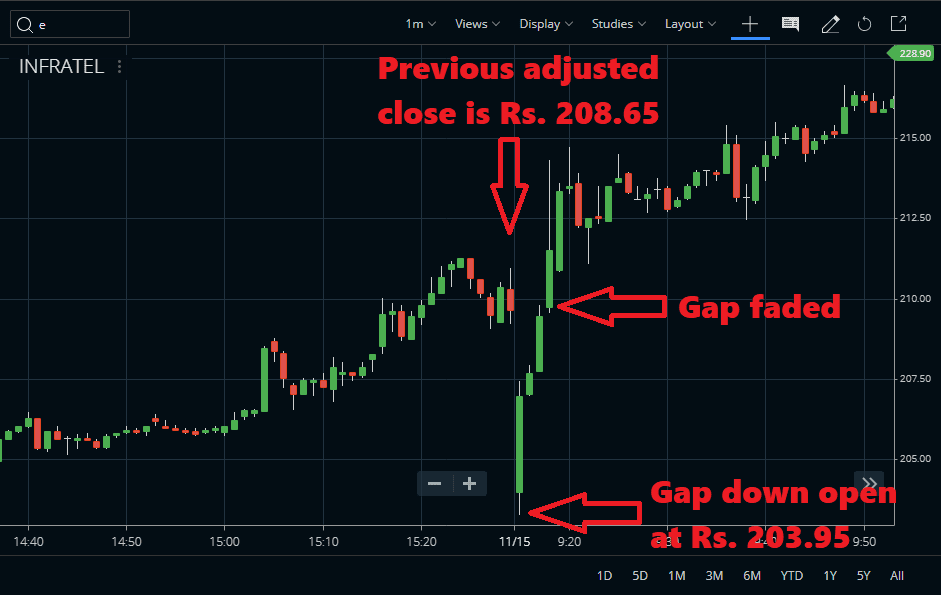
We can see that Infratel’s share last day’s close was at 208.65, and it opened the gap down at 203.95. It is a buying opportunity for the stock. The gap faded within a few minutes after the open. This was a decent profit in the morning itself.
Conclusion
Our screening tool will provide you with the necessary information required to day trade the Indian share market. You can use the two strategies mentioned above. But do not forget to use proper money management in your trades.
The screener highlights stocks showing strong momentum, unusual gaps, and clear trend alignment, helping traders quickly identify potential intraday opportunities. By focusing on stocks where both minor and major trends support the direction, you can filter out weak or sideways setups and concentrate only on higher-probability trades. Always combine the signals from this screener with your own chart analysis, risk management rules, and disciplined position sizing to trade the market more confidently and consistently.