Introduction: Why So Much Confusion Around Stock Delivery?
If you’re new to the stock market, you’ve probably come across terms like intraday trading, futures and options, and delivery trading. But there’s one concept that often puzzles beginners more than others—delivery volume of stocks. You might have seen this figure on stock tracking apps or brokerage dashboards, and wondered, What does this even mean? Is high delivery volume good or bad? Should I use it to make decisions?
For many Indian retail investors, delivery volume can seem like another technical metric lost in a sea of charts, numbers, and jargon. Maybe you’ve tried to analyze it, or someone in a YouTube video told you that a spike in delivery means “smart money is buying”—but you’re still unsure what it actually tells you, or how to act on it.
Here’s the reality: most traders skip this crucial data point or misunderstand it entirely. But once you learn to read and use it the right way, it can become a powerful part of your toolkit—especially if you’re interested in positional trades or long-term investments. This article will break it down for you step-by-step. We’ll explore what delivery volume truly means, how it differs from other types of volumes, why it matters, and how you can actually build a delivery volume strategy to spot serious accumulation or distribution in a stock.
By the time you reach the end of this article, you’ll move from a place of confusion to clarity, equipped with actionable insights and confident in using this underrated metric in your investing journey.
Let’s get started.
What Is Delivery Volume and How Does It Work?
Breaking Down the Basics
In simple terms, delivery volume of stocks refers to the number of shares that are actually transferred from one investor’s demat account to another’s at the end of the trading day. Unlike intraday trades (which are squared off before market close), these are trades where the buyer takes possession of the stock.
So, think of delivery volume as real ownership change, not just speculative activity.
Intraday vs Delivery: A Quick Comparison
| Feature | Intraday Trading | Delivery Trading |
|---|---|---|
| Holding Period | Same day | 1 day or more |
| Margin Availability | High leverage | Low or no leverage |
| Risk Level | High | Moderate to Low |
| Delivery Volume Impact | Not applicable | Highly relevant |
In delivery-based transactions, investors are often more serious. They may be institutions, mutual funds, or informed retail investors. Therefore, studying delivery data gives you insights into what smart money is doing.
Where to Find Delivery Volume?
- NSE website under Bhavcopy
- Stock screener apps like Trendlyne or StockEdge with delivery stats
- Broker dashboards like Zerodha, Upstox, Angel One
You’ll often see two fields:
- Total Traded Volume: All shares bought/sold during the day (including intraday)
- Deliverable Quantity: Shares actually taken for delivery
From these, the delivery percentage is calculated:
Delivery % = (Deliverable Quantity / Total Volume) x 100
This figure is what gives delivery volume real context.
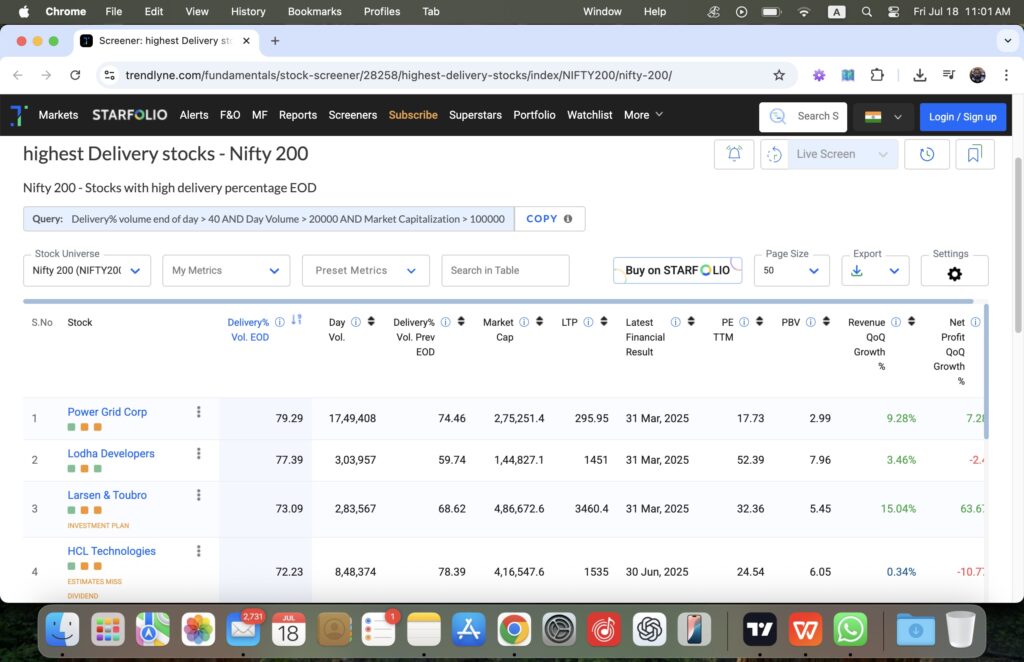
This screener in the Trendlyne website gives a complete list of high delivery volume stocks from the Nifty 200 universe. Check the image below.
Why High Delivery Percentage Signals Serious Buying
It’s Not Just About Quantity—But Intent
Let’s say Stock A had a total traded volume of 10 lakh shares today, and 8 lakh shares were delivered. That’s an 80% delivery percentage—a very high number.
What does it mean?
- Buyers are holding on, not selling immediately.
- It could be a sign of accumulation—where investors are building positions quietly.
- Large players might be entering without creating panic or massive price jumps.
This is quite different from stocks with high trading volume but low delivery—these are often speculative or manipulated plays.






Ideal Ranges to Look For
Here’s a rule of thumb:
- Below 30%: Speculative, mostly intraday
- 30–50%: Neutral or mixed behavior
- 50–70%: Healthy, possible investor interest
- Above 70%: Strong delivery—potential institutional activity
Of course, delivery by itself isn’t enough. You need to combine it with:
- Price action (is the stock rising with high delivery?)
- News or announcements (results, dividends, M&A)
- Volume spikes (are we seeing unusual activity?)
This makes delivery a contextual clue, not a standalone signal.
Case Study: Reliance’s Delivery Spike
In April 2020, Reliance Industries Limited saw a sudden rise in delivery percentage along with a steady price rise—despite market volatility. Within months, it hit new highs. Later disclosures showed mutual funds and FIIs were increasing their stake.
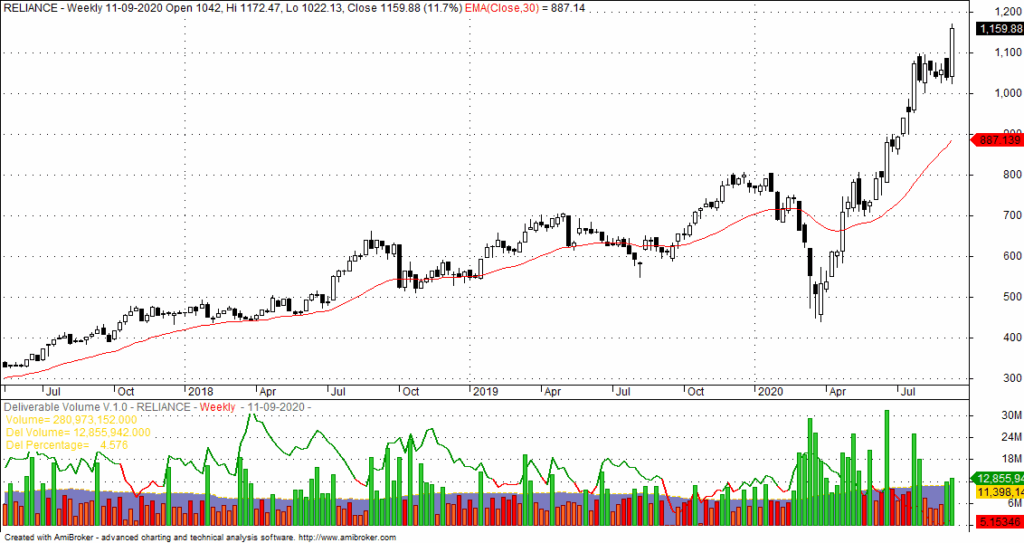
This is the kind of pattern delivery analysis can help you spot.
How to Use Delivery Volume in Your Trading Strategy
Introducing the Delivery Volume Strategy
If you’re looking to include delivery volume in your analysis, start with this simple 3-point strategy:
1. Look for Delivery Spikes with Price Increase
This indicates strong buying interest. Preferably, the price should close near the high of the day.
2. Track Consistency Over Days
One-day spikes can be noise. But if you see 3–5 days of rising delivery percentages along with positive price action, that’s a powerful signal.
3. Cross-check With Open Interest (for F&O Stocks)
Rising delivery + rising OI can confirm long build-up. If OI is falling, it could mean short covering instead.
Example Strategy Setup
Let’s build a quick screen:
- Stock Price > 20-Day Moving Average
- Delivery % Today > 50%
- 3-Day Average Delivery % Rising
- Volume Today > 2x 10-Day Average Volume
You can set this up on platforms like Chartink or manually screen using NSE data and Excel.
When to Avoid This Strategy
- Around result days or major news—volatility can distort data.
- Penny stocks—easily manipulated.
- Stocks with low liquidity—data may be unreliable.
By following a structured delivery volume strategy, you can spot emerging trends early and act with greater confidence.
Risks and Limitations of Relying on Delivery Data
Common Misinterpretations
Delivery volume is helpful—but not foolproof.
- High Delivery ≠ Guaranteed Upside: It can be misleading if the market as a whole is weak.
- Not All Delivery Is Bullish: Sometimes, delivery is high because smart money is exiting quietly.
- Retail Trap: Often, retail investors chase high delivery stats after the move is done.
Risk of Delay in Data
NSE provides delivery volume after market hours. That means you’re working with slightly old information—often a day late for intraday traders.
Lack of Context = Poor Decisions
Delivery volume works best with context. Always combine it with:
- Chart patterns (double bottoms, breakouts, etc.)
- Volume trends (is today’s volume unusually high?)
- Sectoral movements (are peers moving too?)
Using delivery in isolation is like reading one page of a book and guessing the whole story.
The Manipulation Factor
In low-volume or small-cap stocks, delivery percentages can be gamed. Some operators create artificial delivery to lure retail buyers. Stick to fundamentally strong and actively traded stocks to avoid this.
In short: delivery volume is insightful—but only when treated as one piece of the puzzle, not the entire game.
Best Tools and Platforms to Track Delivery Volume
Where and How to Access the Data
As a beginner, you don’t need fancy terminals. These free or low-cost platforms work well:
1. NSE India Website
- Go to www.nseindia.com
- Search for any stock
- Click “Trade Info” → You’ll see Deliverable Quantity and Delivery %
2. Chartink Scanners
- Offers free screeners with delivery filters
- Example filter: [Buyer initiated trade quantity > Seller initiated trade quantity AND Volume > 1.5x Average]
3. TradingView India
- Add custom indicators or use community scripts
- Great for overlaying price + volume + delivery
4. Brokerage Platforms
- Zerodha’s Kite: Check “Market Depth” and “Quote” tabs
- Upstox, Angel One, and Groww offer delivery data summaries
Using Excel for Pattern Analysis
If you’re serious, download the Bhavcopy from NSE daily.
- Sort by delivery % descending
- Filter for consistent high-delivery stocks
- Track price trends manually
This method helps you spot trends before others do—especially if you hold stocks for weeks or months.
Mobile App Recommendations
- StockEdge
- Moneycontrol
- ET Markets
These apps give delivery updates and price alerts that help you act fast.
The goal is not to check data randomly but to systematically observe patterns and act when multiple signals align.
Conclusion: Move from Guesswork to Confident Investing
Many beginners enter the market driven by tips, news, or fear of missing out. But without understanding what truly drives price movements, they often fall into traps—or miss the bus entirely. One of the least talked-about yet highly effective metrics for spotting genuine activity is delivery volume.
You’ve now learned what it is, how it’s calculated, and why it matters. You’ve also explored how to use it in real-world strategy, what risks to watch out for, and the best tools to track it reliably.
Here’s your simple action plan:
- Start tracking delivery data for 5 stocks daily.
- Set up a scanner with delivery + volume + price filters.
- Combine delivery analysis with price action and news flow.
- Avoid penny stocks and speculative plays.
By doing this consistently, you’ll sharpen your eye for quality trades and develop a deep intuition for market behavior. Delivery data won’t make you a fortune overnight—but over time, it will help you avoid bad trades and enter good ones early.
Remember, real investors don’t just chase moves—they understand who is behind them and why they’re happening. Delivery analysis gives you that edge.
You now have the knowledge. It’s time to apply it and level up your stock market journey.