
Introduction: Why Understanding NAV Matters in Mutual Fund Investing
If you’ve recently started exploring mutual funds, you’ve probably come across the term NAV multiple times. But what is NAV in mutual funds? And why do so many experts and platforms highlight it while discussing fund performance?
Imagine this: You’ve just received your monthly salary, and after clearing bills and essentials, you decide to invest ₹5,000 in a mutual fund. You visit a popular investing app, select a mutual fund, and see the NAV listed as ₹42.15. You hesitate. Is ₹42.15 high? Low? Should you wait for it to drop? Or buy it now? You scroll further but get lost in jargon like “growth plan,” “units,” and “expense ratio.”
This is exactly where most beginners feel stuck — you’re financially ready to invest, but conceptually confused. I’ve been there too. In my early days, before my 25-year journey into stock markets and 15 years of blogging and mentoring thousands of new investors across India, I used to treat NAV like a stock price — a huge mistake.
Here’s the truth: NAV is not the mutual fund’s price tag like a stock quote. It’s a calculation, a snapshot, and a very different way to understand your investment’s worth.
In this comprehensive guide, we’ll clear your confusions about the term NAV with complete clarity and confidence in understanding and using NAV while making smarter mutual fund choices.
Whether you’re investing through platforms like Zerodha Coin, Groww, or directly with AMCs like HDFC or SBI Mutual Fund, this post will help you:
- Decode what NAV really means
- Learn how it’s calculated (in simple terms)
- Understand its impact on returns
- Avoid common myths
- Compare NAVs across fund types
- Use NAV smartly for better investing outcomes
Let’s dive deep and make mutual fund investing less intimidating and a lot more actionable.
What is NAV and Why It’s Not the ‘Price’ of a Mutual Fund
NAV Defined in Simple Terms
NAV, or Net Asset Value, is the per-unit value of a mutual fund scheme. It’s calculated at the end of each business day and tells you the value of one unit of the fund.
In plain language:
NAV = (Total value of assets – total expenses) ÷ total number of units
So, if a mutual fund has ₹100 crore worth of assets and 10 crore units, the NAV would be ₹10.
NAV ≠ Stock Price
This is a common mistake. Unlike a stock price that moves every second based on supply and demand, NAV is updated once daily — usually after 9 PM in India — based on the net value of underlying assets (like stocks, bonds, cash, etc.) the fund holds.
Real-World Analogy
Think of a big community lunch where you chip in ₹100. After buying all the ingredients, cooking, and serving, the total cost is calculated and divided equally among all participants. If you invite a friend the next day, and more people have joined in or left, the per-head cost will change. That’s what NAV reflects — the per-person share of the fund’s value.
Example: Day 1 vs. Day 2 NAV
- Day 1: Fund has ₹50 crore assets and 5 crore units → NAV = ₹10
- Day 2: Stocks rise in value, fund now has ₹52 crore assets → New NAV = ₹10.40
You’ve gained ₹0.40 per unit. It’s as simple as that.
How NAV is Calculated: Demystifying the Math
Step-by-Step Breakdown
To calculate NAV, AMCs (Asset Management Companies) use the following formula:


NAV = (Market Value of Securities + Cash & Receivables – Liabilities) ÷ Total Outstanding Units
Let’s look at a real-world hypothetical:
Scenario:
- Market value of fund’s stocks & bonds: ₹200 crore
- Cash in bank: ₹10 crore
- Liabilities (fees, pending payments): ₹5 crore
- Outstanding units: 20 crore
NAV = (₹200 + ₹10 – ₹5) ÷ 20 = ₹205 ÷ 20 = ₹10.25
Key Components Explained:
- Assets: Stocks, bonds, and other investments
- Cash: Includes unallocated cash, interest income, dividends
- Liabilities: Management fees, transaction costs, other expenses
- Units: Total units issued to investors
Impact of Fund Type on NAV
- Equity Funds: NAV fluctuates daily due to stock market movements
- Debt Funds: NAV is relatively stable, reflecting interest income
- Liquid Funds: Very low volatility; NAV increases gradually
My Experience with Tracking NAV
I remember investing in a balanced fund during the 2020 lockdown. The NAV dipped temporarily when markets crashed, but because I understood the underlying assets, I stayed invested. By 2021, the NAV had grown 35% — proving that understanding NAV is crucial, but panicking over daily NAV changes is not.
Does a Higher or Lower NAV Mean It’s Better or Worse?
Common Misconception: Low NAV is Cheap
Many beginners think, “I’ll buy a fund with ₹10 NAV instead of ₹150 — I’ll get more units!”
But here’s the truth:
NAV tells you the per-unit value — not whether a fund is “cheap” or “expensive.”
What really matters is the fund’s performance, not its NAV.
Let’s Compare Two Funds
| Fund Name | NAV | 1-Year Return | Corpus |
|---|---|---|---|
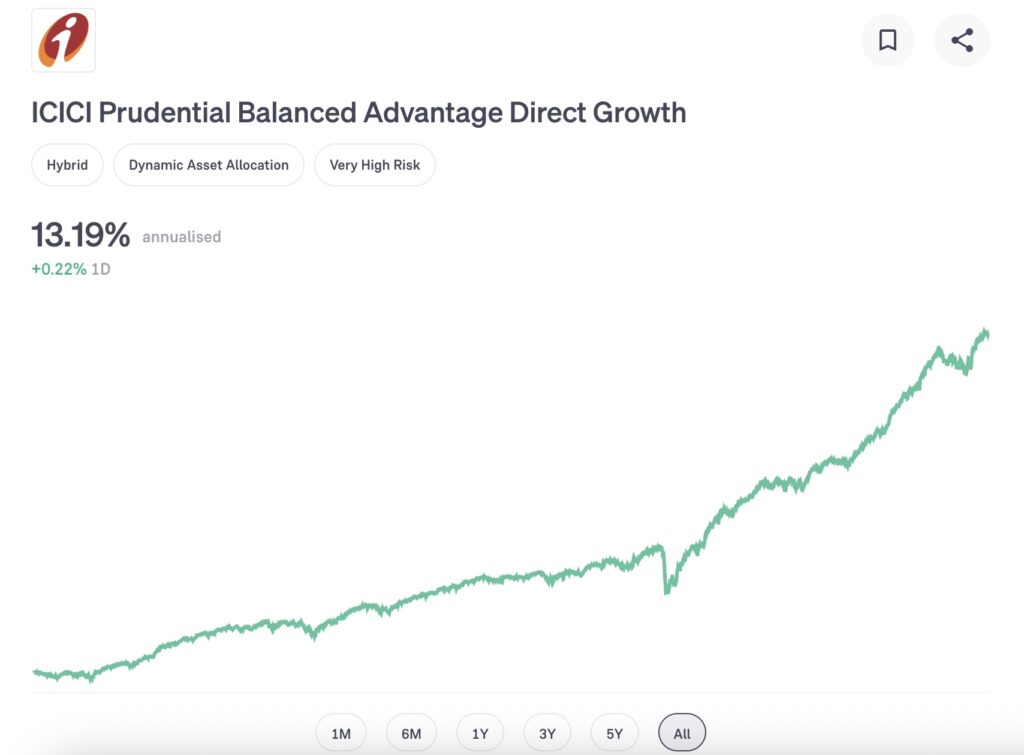
| ICICI Prudential Balanced Advantage Fund | ₹82.47 | 8.56% | ₹65297.87 Cr |
| Canara Robeco Manufacturing Fund New Fund Offer | ₹10.00 | 3.46% | ₹1671.50 Cr |
Even though Canara Robeco’s NAV is lower, ICICI’s older fund has a stronger track record and higher corpus. Buying more units of a weaker fund doesn’t make you richer.
Analogy: NAV vs. Pizza Slices
Would you rather have 2 large slices of pizza from a premium outlet or 10 tiny slices from a cheap shop? It’s not about quantity of units, but quality of investment.
Case Study: NFO Trap
One of my clients, Ramesh from Hyderabad, once put ₹1 lakh into an NFO (New Fund Offer) just because the NAV was ₹10. After 2 years, the fund barely moved. Had he chosen a consistent performer with ₹90 NAV, he could’ve doubled his capital.
When and How NAV Affects Your Returns
When NAV Matters Most
NAV becomes critical when:
- You buy or sell units
- The market is volatile
- You are comparing performance over time
Formula for Return:
Return (%) = [(Current NAV – Purchase NAV) ÷ Purchase NAV] × 100
Example:
- Bought units at NAV ₹20
- Current NAV is ₹26
- Return = [(26-20)/20] × 100 = 30%
SIP vs. Lump Sum Impact on NAV
- In SIPs, you buy at different NAVs each month, averaging your cost over time (called rupee-cost averaging).
- In lump sum, your entire investment is tied to one NAV.
Scenario: SIP NAV Advantage
Suppose Priya invests ₹5,000/month in a mutual fund.
| Month | NAV | Units Bought |
|---|---|---|
| Jan | ₹50 | 100 |
| Feb | ₹40 | 125 |
| Mar | ₹45 | 111.11 |
She ends up buying more units when NAV drops, reducing average cost — a built-in advantage for long-term investors.
Using NAV to Compare and Choose Mutual Funds
NAV Comparison Isn’t Enough
When choosing funds, don’t just compare NAVs. Consider:
- Fund category: Equity, hybrid, debt
- Risk level: High for small-cap, low for liquid
- Expense ratio: Lower the better
- Consistency: Check 3-year, 5-year returns
- AUM (Assets Under Management): Indicates trust and size
Tools You Can Use
- Value Research Online: In-depth NAV history and ratings
- Morningstar India: Comparative analysis
- AMFI India: Official NAV data
- Fund fact sheets: Provided by AMC websites
My Favorite Way to Compare NAV
I prefer using rolling returns over absolute NAV growth. For example, I track how a fund performed every year for the last 5 years — rather than cherry-picking just one good year.
Quick Checklist:
- ✅ Don’t chase low NAVs
- ✅ Look at long-term CAGR
- ✅ Consider fund manager’s track record
- ✅ Use NAV to monitor performance, not to select new funds
Common Myths and Mistakes About NAV
Myth #1: NAV of ₹10 is a “fresh” fund, so it’s better
Truth: NAV resets to ₹10 for NFOs, but it doesn’t guarantee better growth. Established funds with high NAVs often outperform.
Myth #2: NAV affects market value like a stock price
Truth: NAV is not driven by market speculation. It’s a calculated book value based on assets.
Myth #3: You missed out if NAV increased
Truth: NAV changes daily. What matters is when you invest and how long you stay.
Mistake: Ignoring Exit Load and Expense Ratio
Sometimes, even with good NAV growth, high expense ratios and exit loads can eat into your returns. Always factor these in while evaluating a fund.
Personal Case: Exit Load Shock
In 2018, I exited a short-term debt fund early and lost 1% to exit load. Lesson learned: check the fine print, not just NAV charts.
Conclusion: Making Confident Mutual Fund Decisions Using NAV
So, now you know — what is NAV in mutual funds isn’t just a boring technical term. It’s the heartbeat of your mutual fund investment.
NAV shows you the current value of your holdings. But it’s not a rating, not a stock price, and certainly not a buy signal.
Let’s recap:
- NAV helps you track fund performance, not compare between funds.
- Low or high NAV doesn’t mean better or worse.
- Returns are based on NAV growth over time, not its starting point.
- Use SIPs to ride NAV fluctuations smartly.
- Don’t fall for NFOs just because of ₹10 NAVs.
If you’re a new investor in India, looking to build wealth safely, understanding what is NAV in mutual funds is a key first step. But even more important is consistency, long-term thinking, and selecting the right fund type based on your goals.
Final Action Steps:
- Choose 2–3 funds you already own or are considering
- Check their NAV trends on AMFI or Value Research
- Compare past performance (CAGR), not just NAV
- Review exit loads and expense ratios
- Start or continue your SIPs — NAV will take care of itself!
Remember, investing is not about timing the NAV. It’s about time in the market.
Updated: July 2025 — Indrajit Mukherjee, 25+ Years in Indian Stock Markets


