For more than two decades, I have been actively trading the Indian markets. Since 2002, I have tested countless indicators, trading systems, and mathematical models. Many of them look impressive on paper but fail in live markets. A few classic concepts, however, have stood the test of time. One such fascinating tool is the Gann calculator, especially the Gann Square of 9, which traders use to identify potential support, resistance, targets, and intraday reversal zones.
⚙️ Gann Square of 9 Calculator (Interactive Tool)

| Res 1 | Res 2 | Res 3 | Res 4 | Res 5 |
|---|---|---|---|---|
| Sup 1 | Sup 2 | Sup 3 | Sup 4 | Sup 5 |
|---|---|---|---|---|
Targets:
Stoploss:
Targets:
Stoploss:
This proprietary Gann calculator online is designed for intraday traders and supports:
- Equity markets
- Commodity markets
- Forex markets
How to use it
- Enter the current market price
- Click Calculate
- The tool instantly generates:
- Buy above level
- Sell below level
- Multiple targets
- Stop-loss levels
The calculator interface resembles the grid shown in the image above and uses a proprietary implementation derived from the Gann Square of 9 framework. The exact calculation method is intentionally not disclosed to maintain the integrity of the tool.
Since launching StockManiacs.net in 2008, I have mentored thousands of traders across India through my blog, tools, and broker partnerships with Zerodha, Upstox, and Fyers. One consistent observation stands out: most retail traders lose money not because they lack information, but because they lack clear trading levels and a disciplined framework.
That is exactly why this Gann calculator for intraday trading exists.
Instead of forcing traders to learn complex mathematical formulas or build spreadsheets, the calculator instantly converts a price into structured trading levels that you can use to plan entries, exits, and risk management.
What Is a Gann Calculator and Why Do Traders Use It?
The answer is straightforward.
A Gann calculator converts the current market price into geometric price relationships derived from the Gann Square of 9 concept. These levels can act as:
- Support zones
- Resistance zones
- Potential price targets
- Reversal points
The concept originates from the Square of 9 spiral chart, where numbers expand outward from a center value in a spiral pattern, forming angular relationships such as 45°, 90°, 180°, and 360°.
In simpler words:
Markets often move in structured price relationships, and the calculator attempts to identify those relationships.
Why traders prefer this approach
After mentoring 20,000+ traders, I noticed most beginners struggle with:
- Choosing the entry price
- Choosing exit targets
- Placing a stop loss
The Gann calculator 9 removes much of this confusion by providing pre-calculated trading levels.
Who Was W.D. Gann and Why His Methods Still Matter
To understand the logic behind this tool, you must first know William Delbert Gann.
Gann was a legendary trader born in 1878 who developed several analytical frameworks combining:
- Geometry
- Mathematics
- Time cycles
- Market psychology
His famous tools include:
- Gann Angles
- Square of 9
- Circle of 360
- Hexagon chart
These tools attempt to map price movements to geometric relationships.
My personal experience studying Gann
When I first encountered Gann theory in the early 2000s, I dismissed it as overly complex. However, while testing trading systems in MetaStock and AmiBroker, I repeatedly observed something interesting.
Certain price levels acted as strong support or resistance, even when traditional indicators failed.
Many of those levels aligned with Gann-derived price relationships.
That sparked my deeper research into the concept.
How the Gann Square of 9 Works (Simple Explanation)
The Gann Square of 9 is essentially a spiral number grid arranged inside a square.
Basic structure
The spiral begins with 1 at the centre, and numbers expand outward forming rings.
| Ring | Number Range |
|---|---|
| 1 | 1 – 9 |
| 2 | 10 – 25 |
| 3 | 26 – 49 |
| 4 | 50 – 81 |
The spiral can expand infinitely to accommodate higher price ranges.
Important angular relationships
Within the square, specific directions correspond to angles.
| Angle | Meaning |
|---|---|
| 45° | Minor reaction level |
| 90° | Support / resistance |
| 180° | Major reversal zone |
| 360° | Full price cycle |
These angular lines are sometimes called “vibration paths.”
Modern trading tools approximate these relationships using mathematical transformations of price.
The calculator on this page performs these calculations automatically.
How to Use the Gann Calculator for Intraday Trading
Through years of market observation, I have developed a simple workflow for using the Gann calculator online.
- Step 1
Wait at least 30–60 minutes after market open.
- Step 2
Note the current market price or average traded price.
- Step 3
Enter that price in the calculator.
- Step 4
Click Calculate.
- Step 5
Use the generated levels to plan trades.
You will get:
1) Buy above level
2) Sell below level
3) Target levels
4) Stoploss level
On 15 November 2019, the Nifty futures price was around 11941.70.
The calculator generated:
Buy above: 11962.89
Targets:
- 11984.77
- 12012.15
- 12039.57
- 12067.02
Stoploss:
11935.56
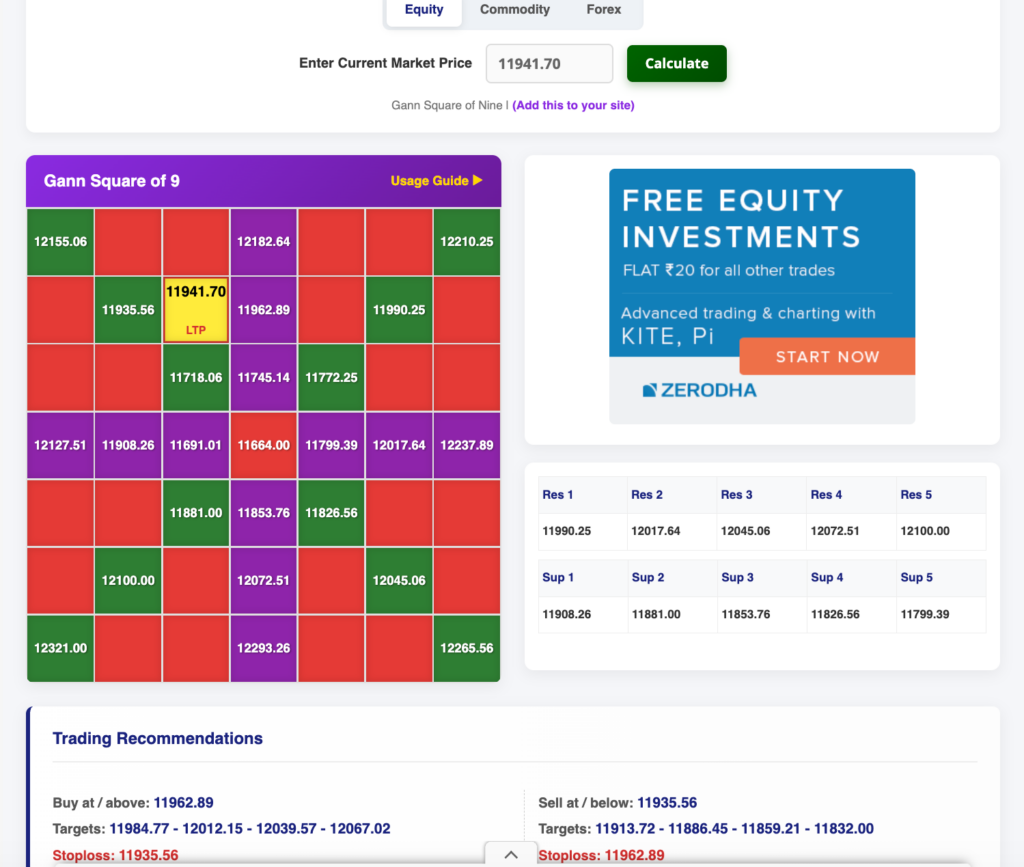
It also simultaneously generated short sell levels as shown in the image above.
We entered 2 bracket orders for both the buy and sell levels. The buy order has triggered. We cancelled the short sell order. The price zoomed to our first target in no time. Check the image below to understand the trade.
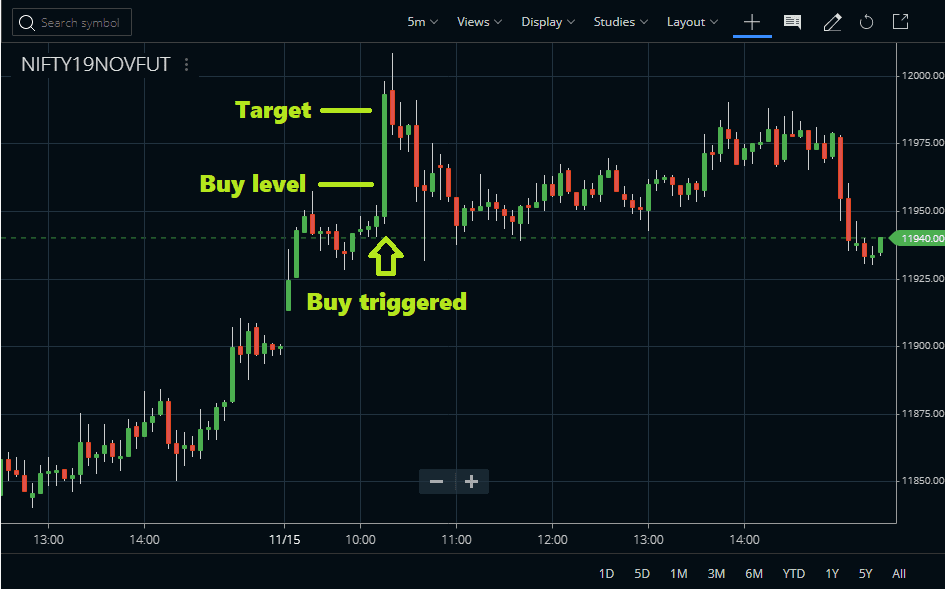
This example shows how structured levels can simplify intraday trading.


Gann Calculator Trading Example on Commodity
On the 28th of April, 2026, at 10 AM, Gold Futures were trading at 151587. We checked the Gold signals in the calculator.
We got:
Buy at/above: 151612.89
Targets: 151690.77 – 151788.16 – 151885.57 – 151983.02
Stoploss: 151515.56
Sell at/below: 151515.56
Targets: 151437.72 – 151340.45 – 151243.21 – 151146.00
Stoploss: 151612.89
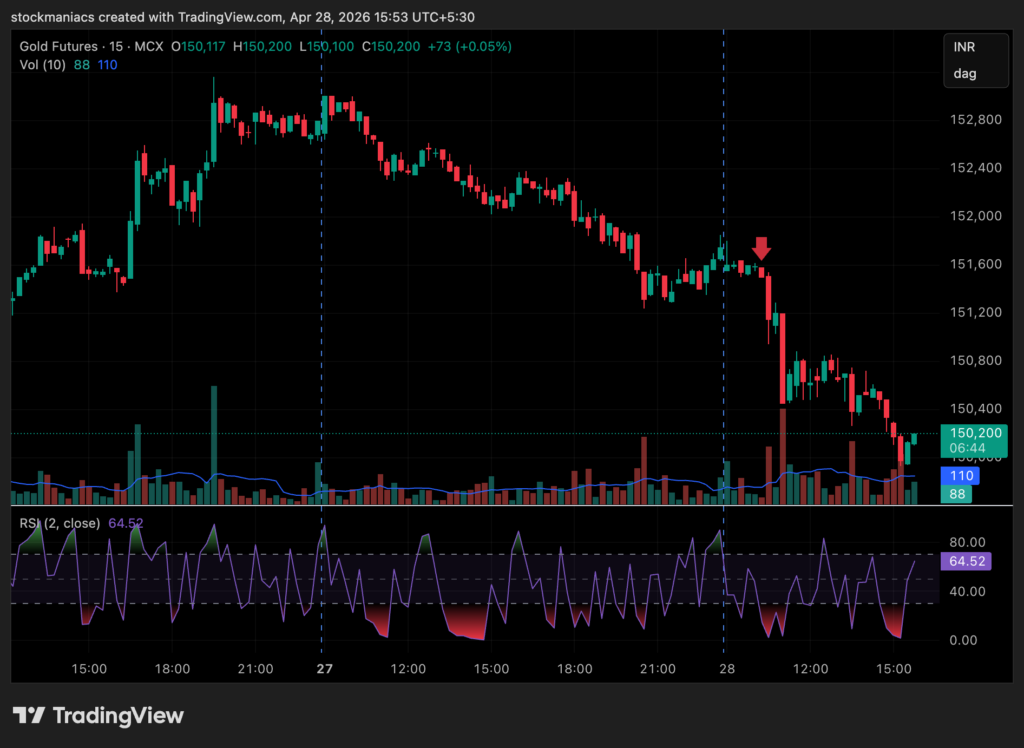
From there, the Gold futures crashed 150450 within the next one hour, marking all our short sell targets.
GANN Square Of 9 Calculator – Video Guide
Can You Use the Gann Calculator in Forex or Cryptocurrencies?
Yes.
The concept behind the Gann calculator equity/commodity/forex strategy works across multiple markets.
The same logic can be applied to:
- Forex pairs (EURUSD, GBPUSD, USDINR, etc.)
- Cryptocurrencies (Bitcoin, Altcoin, Solana, etc)
- Stocks
- Indices
The only requirement is a liquid market with consistent price movement.
My observation from the Indian markets
In practice, I find the tool works best in:
- Nifty
- Bank Nifty
- High liquidity stocks
Liquidity improves the chances that the price will respect calculated levels.
Common Mistakes Traders Make With Gann Tools
Many traders misuse Gann-based systems.
Here are the most common mistakes I see.
Blind faith in levels
No indicator or tool predicts markets perfectly.
Markets react to:
- News events
- Global cues
- Institutional flows
Overtrading
Taking every signal leads to losses.
Ignoring stoploss
This is the fastest way to destroy a trading account.
The correct approach
Use Gann levels as reference zones, not guaranteed predictions.
Trader Testimonials for the GANN Square of 9 Calculator
Over the years, many traders have shared their experience using this tool.
Rajesh K. – Intraday Trader
“I use the gann calculator daily for Nifty levels. It helps me plan trades before the market moves.”
Amit S. – Bank Nifty Trader
“This is one of the simplest tools I use. Instead of guessing levels, I follow the calculator output.”
Neha D. – Forex Trader
“The gann calculator forex method works surprisingly well for EURUSD support and resistance zones.”
Risks and Limitations
A responsible mentor must always be transparent.
While many traders find Gann tools useful, they remain controversial in academic finance.
Critics argue that:
- Results depend on pivot selection
- Different traders may obtain different interpretations
- Statistical validation is limited
Therefore, these tools should be used as decision-support frameworks, not guaranteed prediction systems.
Risk management rules
Always follow these principles:
- Risk only 1–2% of capital per trade
- Always use stoploss
- Avoid revenge trading
- Practice using paper trades first
Conclusion
After more than 20 years of trading experience, I can confidently say this:
Successful trading does not depend on finding a magical indicator.
It depends on structure, discipline, and risk control.
The Gann calculator simply helps provide that structure.
Instead of guessing where the market might go, you receive:
- Clear entry levels
- Defined targets
- Pre-planned stoploss
Use the tool responsibly, observe how the price behaves around the levels, and gradually develop your own trading system.
With patience and discipline, tools like this can become a valuable part of your intraday trading toolkit.
Suggested Reading on GANN Square of 9 and the Calculator
For more step-by-step guides and information on the GANN Square Of 9 calculator, there is a classic book, The Definitive Guide to Forecasting Using W.D. Gann’s Square of Nine by Patrick Mikula. We suggest you read this. This book is also available on Amazon, and it is highly costly.
You can buy this book from Amazon. However, we have provided the download link of this ebook for free to our readers.
Frequently Asked Questions (FAQ)
The Gann Square of 9 is a spiral number chart used in technical analysis to identify potential support, resistance, and price targets. Developed by W.D. Gann, it organises numbers in a geometric spiral where certain angles like 45°, 90°, 180°, and 360° are believed to correspond to important market turning points.
A Gann Square of 9 calculator automatically converts the current market price into potential trading levels based on the Square of 9 concept. Traders use it to quickly generate buy levels, sell levels, targets, and stop-loss zones without manually calculating the spiral relationships.
Most traders follow a simple approach:
1) Enter a reference price (current price or pivot level).
2) Generate Gann levels using a calculator or chart.
3) Watch how the price reacts near those levels.
4) Combine the levels with price action and trend analysis before taking a trade.
Many traders report that the Square of 9 can help identify structured price levels in markets. However, it should not be treated as a guaranteed prediction system. It works best when used alongside risk management and other technical indicators.
Yes. Many intraday traders use a Gann calculator to generate levels after the first hour of trading and use them as potential intraday support and resistance zones.
Yes. Traders often build Gann Square of 9 Excel sheets to visualise the spiral grid and calculate levels. However, most traders now prefer using online calculators because they generate levels instantly.
Check Our Other Trading & Investment Tools
- Nifty Trend Finder Calculator – Identify the current Nifty market trend using technical indicators and price action.
- Pivot Point Calculator – Calculate pivot levels, support, and resistance for intraday trading.
- Camarilla Calculator – Generate precise intraday support and resistance levels using Camarilla formulas.
- Elliott Wave Calculator – Analyse wave structures and potential market movement patterns.
- Fibonacci Calculator – Find Fibonacci retracement and extension levels for technical analysis.
- Volatility Calculator – Measure market volatility and assess trading risk effectively.
- Mutual Fund Return Calculator – Estimate SIP and lump sum mutual fund investment returns easily.
- LIC Maturity Calculator – Calculate the estimated maturity value for LIC insurance policies.
- LIC Surrender Value Calculator – Estimate the surrender value of your LIC policy quickly.