This BankNifty open interest chart will be highly effective in finding hidden support and resistances of the Bank Nifty index. You can get an idea of where to buy or sell the index. You can also get an idea of the overall trend of the index.
Bank Nifty Options Data Signal and VWAP Signal
Get these signals in Telegram
| Time | CE COI | PE COI | COI Diff | Data Signal | PCR | Future LTP | VWAP | VWAP Signal |
|---|
The above chart shows Bank Nifty options data signal and PCR or put call ratio. Also, you can see the signals based on the VWAP indicator. The data will be printed from 10 AM to 03:45 PM after every 15 minutes. The tables and charts will auto-refresh themselves. Hence, there is no need to manually refresh the page to see the updated data. Read the usage guide on how to interpret the options data of NSE.
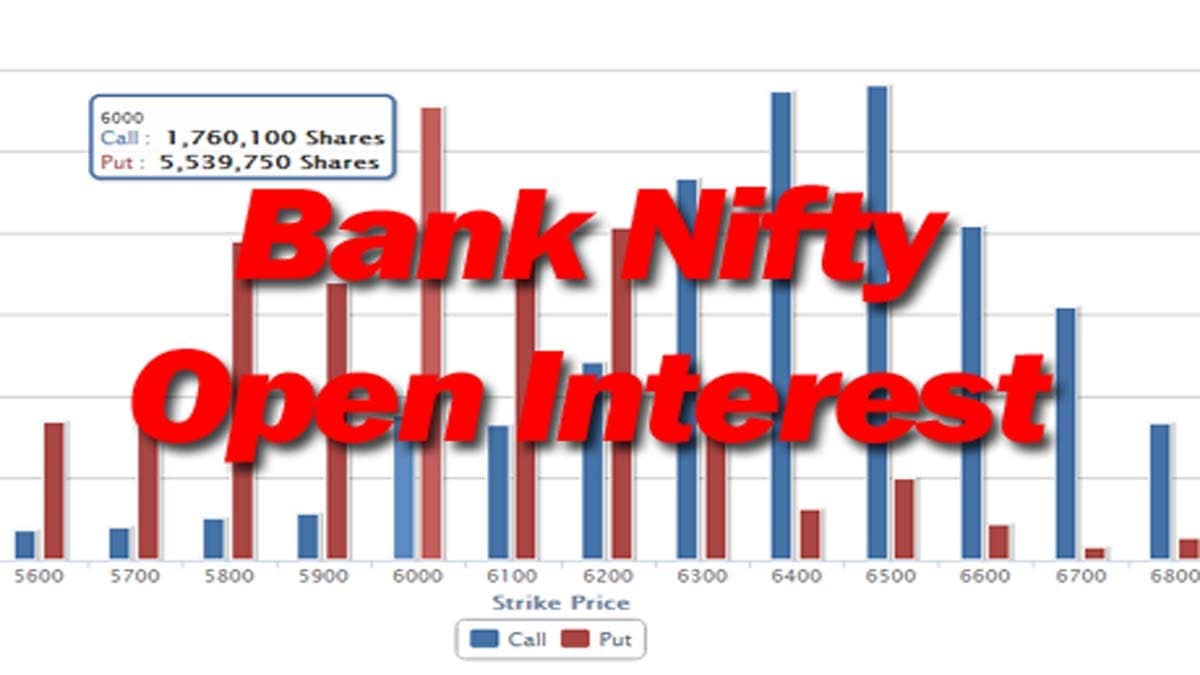
Bank Nifty Open Interest (Call OI and Put OI)
Bank Nifty Open Interest Change
For more usage instructions CLICK HERE.
The above 2 charts show strike price-wise Bank Nifty Open Interest and Change of Open Interest. The chart below shows the aggregate change of OI for 20 strikes above or below VWAP.
Bank Nifty Aggregate Change of OI (20 Strikes)
What is Open Interest?
At the end of each day, the number of contracts that are still open is called open interest. Open interest is a way to measure how many people are buying and selling futures.
If both people in the trade start a new position (one buyer and one seller), the amount of open interest will go up by one contract. This means that open interest will drop by one contract if both traders are closing a previous or old position. One old buyer and one old seller would do this. Open interest will not change even if one old trader sells his position to a new trader.
Increased open interest means that more money is coming into the market. In the end, the trend (up, down, or sideways) will keep going. In contrast, a decrease in open interest means that the market is getting rid of things and that the current price trend is coming to an end. So, open interest is a good way to see if there is going to be a change in the trend.
For any given market, we only need to know how many buyers or sellers there are. We don’t need to know how many people are on both sides.
Tags: bank nifty open interest, banknifty open interest, bank nifty oi, banknifty oi