“Price is what you pay. Value is what you get.” – Warren Buffett
If you have ever watched the Nifty or Bank Nifty on expiry day, you may have noticed something strange. Prices often hover around certain strike levels as if they are being pulled by an invisible force. This phenomenon has led traders to explore a concept called “Options Max Pain”.
The options max pain theory suggests that, as expiry approaches, the underlying price tends to move toward a level where the maximum number of option buyers lose money. This level is known as the max pain point. While it sounds simple, traders often struggle to understand how to use it effectively.
Many beginners treat max pain as a prediction tool. Others dismiss it completely after a few failed trades. The truth lies somewhere in between. Max pain is not a magical indicator, but it can be a powerful context tool when used correctly.
On this page, you will get:
• Live Nifty max pain today
• Live Bank Nifty max pain chart
• Options max pain calculator logic
• Excel calculator download
• Real trading strategies
• Limitations and myths
Nifty Max Pain Today (Live)
The most important thing traders look for is the current max pain level.
Current Max Pain (Nifty): Auto Updated
Current Max Pain (Bank Nifty): Auto Updated
Traders often use this level as a reference point during expiry week. If the current price is far from max pain, there is a tendency for price to move toward it. If the price is already near max pain, markets often become range-bound.
However, it is important to remember that max pain changes throughout the day as open interest shifts.
What Is Max Pain in Options?
Max pain is the strike price at which option buyers lose the most money and option sellers gain the most at expiry.
It is calculated using open interest data from both call and put options across multiple strike prices.
In simple terms:
• It is the point where most options expire worthless
• It represents the minimum payout for option sellers
• It reflects positioning in the market
Options Max Pain Theory Explained
The theory behind max pain is rooted in open interest distribution.
When a large number of contracts are written at certain strike prices, it creates clusters. These clusters act as magnets because:
• Sellers want options to expire worthless
• Hedging activity influences price movement
• Psychological levels attract traders
As expiry approaches, time decay accelerates and positions become more sensitive.
How Is Max Pain Calculated?
Max pain is calculated using open interest (OI) data from the options chain, and it represents the strike price where the total loss for option buyers is the highest. This is also the point where option sellers (writers) incur the least payout.
To understand this clearly, think of every strike price as a possible expiry level. At each level, some options will expire in the money (ITM), and their intrinsic value must be paid by sellers. The goal of the calculation is to find the strike where this total payout is minimised.
The process involves:
- Taking all available strike prices for a specific expiry
- Calculating intrinsic value for both call (CE) and put (PE) options
- Multiplying intrinsic value by open interest at each strike
- Summing total losses across all strikes
- Identifying the strike with the lowest total payout
That strike is known as the max pain level.
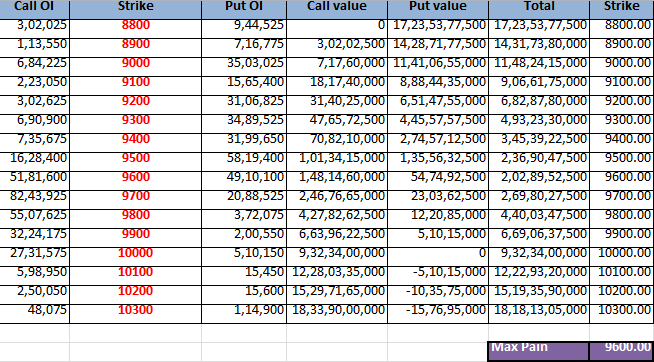
This method is based on the “payout model,” which is considered more accurate than simply counting contracts. It reflects the actual financial impact on option sellers.
Why Max Pain Changes Daily
Max pain is not a fixed number. It keeps changing throughout the trading session and across days due to continuous shifts in market positioning.
The primary reason behind this is the dynamic nature of open interest. Traders are constantly entering and exiting positions, which causes OI to build up at some strikes and unwind at others.
Several factors influence this movement:
- Open interest buildup at new strike prices
- Position shifting by traders during the day
- Institutional hedging activity
- Changes in market sentiment
Because of these factors, yesterday’s max pain may become irrelevant today. Even within the same day, max pain can shift significantly.
This is why traders should always rely on live max pain data instead of static calculations or outdated Excel sheets.
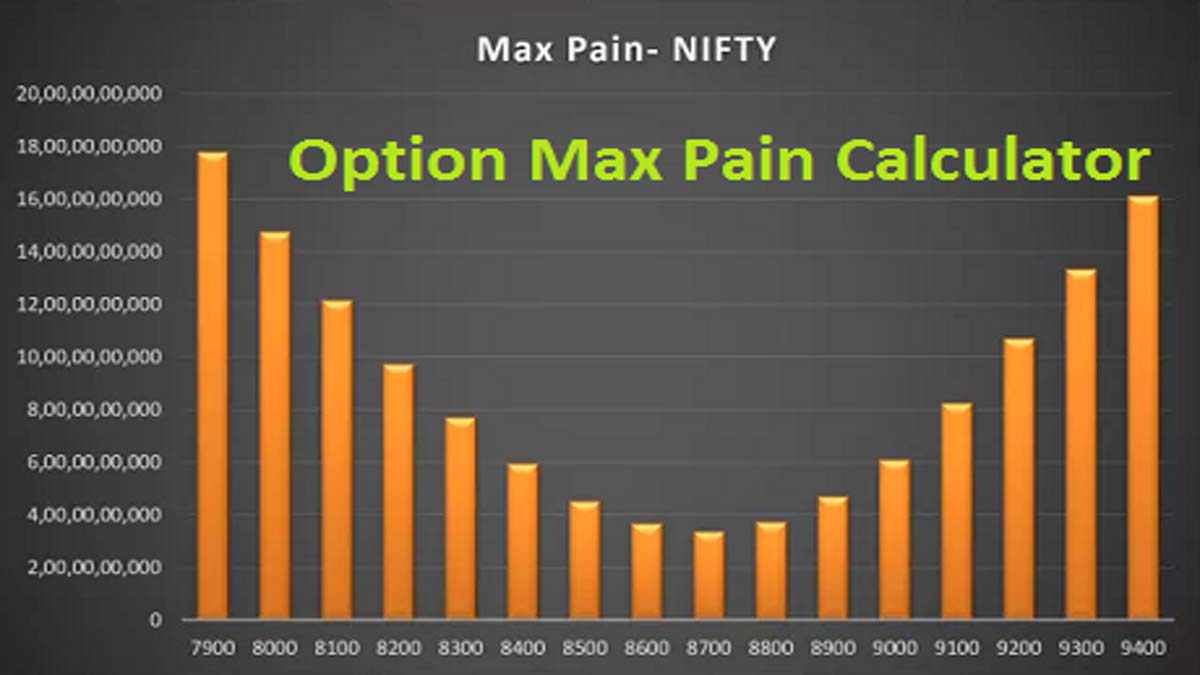
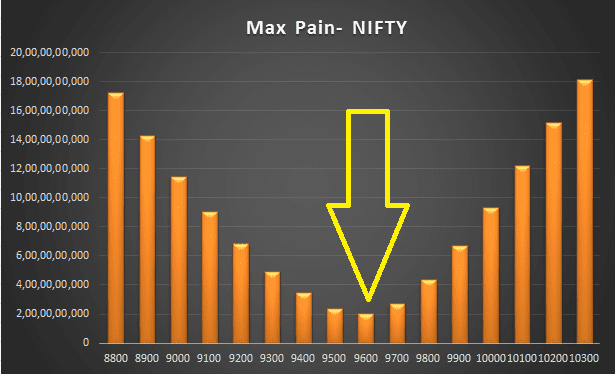
Nifty & Bank Nifty Max Pain Charts
Max pain charts provide a visual representation of how option positioning is distributed across different strike prices. These charts are extremely useful because they simplify complex data into an easy-to-understand format.
Typically, these charts display:
- Strike prices on the horizontal axis
- Total pain or payout on the vertical axis
- A highlighted bar showing the max pain level
By analysing these charts, traders can quickly identify where the majority of option positions are concentrated. This helps in understanding key support and resistance zones.
For example, if a large amount of open interest is clustered around a particular strike, it often acts as a magnet for price movement during expiry week.
These charts are especially powerful when combined with other indicators like PCR and price action.
How to Use Max Pain in Trading
Max pain is best used as a contextual indicator, not a standalone signal. It helps traders understand where the market might gravitate during expiry.
A practical approach to using max pain includes:
- If the current price is far from max pain, there may be a tendency for price to move toward it
- If the price is near max pain, markets often become range-bound
- Combine max pain with Put-Call Ratio (PCR) and open interest data
- Use it primarily during expiry week for better accuracy
Professional traders do not rely on max pain alone. Instead, they use it alongside price action, support/resistance levels, and overall market trend.
Does Max Pain Theory Really Work?
The effectiveness of max pain theory is widely debated among traders. While many believe in its validity, others consider it unreliable.
In reality:
- It tends to work better as expiry approaches
- It is less effective in strong trending markets
- It does not guarantee price movement
The biggest mistake traders make is treating max pain as a prediction tool. It is not designed to forecast exact price levels but to reflect market positioning.
The correct way to use max pain is as a probability-based reference, not a certainty.
Common Mistakes
Many traders misuse max pain due to a lack of proper understanding. This often leads to poor trading decisions.
Common mistakes include:
- Blindly trusting max pain without confirmation
- Ignoring intraday changes in open interest
- Using outdated or static data
- Taking oversized positions based on a single indicator
Avoiding these mistakes can significantly improve your trading performance when using max pain.
Options Max Pain Excel Calculator
The Excel calculator is a useful tool for traders who want to understand how max pain is computed manually. It allows you to work with real option chain data and see how different strike prices contribute to total payout.
Key benefits include:
- Automatic calculation of max pain
- Ability to analyse open interest distribution
- Useful for strategy building and backtesting
However, Excel-based tools may sometimes fail due to data fetching issues or changes in the NSE format. In such cases, using a live calculator is a better option.
Why Chart May Not Work
Sometimes, the max pain chart may not load properly or show incorrect data. This is usually due to technical issues rather than calculation errors.


Common reasons include:
- Delay in data fetching from NSE or Google Sheets
- API or script loading issues
- Browser cache conflicts
To fix this, you can try refreshing the page, clearing the cache, or switching to another browser. Ensuring a stable internet connection also helps.
Advanced Strategy
Experienced traders use max pain as part of advanced options strategies. Instead of predicting direction, they focus on probability and positioning.
Some commonly used strategies include:
- Selling straddles near the max pain level when the price is expected to remain range-bound
- Using iron condors around max pain to benefit from time decay
- Trading breakouts when the price moves significantly away from max pain
These strategies require proper risk management and should not be used blindly.
Max Pain vs Other Indicators
Max pain becomes more effective when combined with other indicators. Relying on it alone can lead to misleading conclusions.
The best combinations include:
- Put-Call Ratio (PCR) for sentiment analysis
- Open Interest (OI) for position buildup
- Support and resistance levels for price confirmation
Using these together provides a more complete view of the market.
Limitations
Despite its usefulness, max pain has several limitations that traders must understand.
- It is not a predictive tool
- It changes frequently due to OI shifts
- It does not account for news or macro events
Because of these limitations, max pain should always be used with caution.
Detailed Example
To calculate max pain manually, you take multiple strike prices and compute the total payout for each possible expiry level. The strike where this payout is the lowest becomes the max pain point.
This process helps traders understand how different option positions influence the market.
Institutional Behavior
Institutional players play a major role in options markets. They are typically option sellers and use hedging strategies to manage risk.
Their activities include:
- Writing options to collect premium
- Hedging positions using futures or other derivatives
- Influencing price zones through large positions
This is one reason why max pain levels often act as important price zones.
Expiry Behavior
During expiry week, market behaviour changes significantly due to time decay and position adjustments.
Typical patterns include:
- Price consolidation near max pain
- Sudden moves during the final hours
- Increased volatility due to gamma effects
Understanding these patterns can help traders plan better.
Weekly vs Monthly
Max pain behaves differently in weekly and monthly experiments.
- Weekly expiry tends to be more volatile and reactive
- Monthly expiry is generally more stable due to larger positions
Traders should adjust their strategies accordingly.
Stocks vs Indices
Max pain works better in index options like the Nifty 50 index and Bank Nifty index because of higher liquidity and participation.
In individual stocks, results may vary due to lower volume and event-driven moves.
Combining with OI
When max pain aligns with strong open interest levels, it becomes a more reliable indicator.
This alignment indicates strong market positioning and increases the probability of price reaction.
Combining with PCR
PCR helps measure market sentiment. When used with max pain, it provides better confirmation.
For example, a high PCR near max pain may indicate bullish sentiment.
Trading Workflow
A structured approach helps in using max pain effectively.
- Monday: Identify initial max pain
- Wednesday: Monitor shifts in positioning
- Thursday: Execute trades based on final levels
This workflow improves consistency.
FAQ (Max Pain Explained Simply)
Max pain is the strike price at which option buyers incur the maximum loss at expiry, while option sellers make the highest profit. It is derived from open interest data and reflects where most options expire worthless.
Max pain is not always accurate as a prediction tool. It works best as a reference level, especially during expiry week, but can fail in trending or news-driven markets.
No, max pain cannot predict the exact expiry price. It only indicates a probable zone based on market positioning.
Intraday traders use max pain as a reference level. If the price is far away, they watch for a pull toward it. If the price is near it, they expect range-bound movement. It should always be combined with price action and open interest shifts.
Different tools may use varying calculation methods (payout vs contract count), data sources, or update frequencies. This can lead to slight variations in max pain levels.
Max pain should be checked multiple times during the day, especially in expiry week, because open interest changes continuously and can shift the level.
Myths
There are many misconceptions about max pain.
- It is not market manipulation
- It does not guarantee price movement
- It should not be used alone
Understanding these myths prevents misuse.
Case Study
In many cases, price tends to move toward max pain during expiry. However, there are also instances where it diverges due to strong trends or news events.
This highlights the importance of using max pain with other indicators.
Checklist
Before using max pain, ask:
- Is the market trending?
- Is OI aligned with max pain?
- Does PCR confirm the bias?
This checklist helps filter better trades.
Risk Management
Risk management is essential when trading with max pain.
- Always use stop-loss
- Hedge positions when required
- Avoid over-leveraging
Even the best setups can fail without proper risk control.
Summary
Max pain is a useful concept that reflects the option seller’s advantage. It is based on open interest and works best during expiry.
However, it should always be used alongside other indicators.
Practical Takeaway
The best approach is to observe how max pain behaves over time before using it in live trading.
Start small, test strategies, and gradually scale up as your confidence improves.
This disciplined approach will help you use max pain effectively and avoid unnecessary losses.
Final Conclusion
Max pain is a powerful concept when used correctly. Combine it with discipline, risk management, and continuous learning to build a sustainable trading edge.
Consistency and patience will ultimately determine your success in options trading. Keep learning, keep testing, and keep improving your strategies over time. Stay disciplined, manage risk wisely, and focus on long-term growth rather than short-term gains.