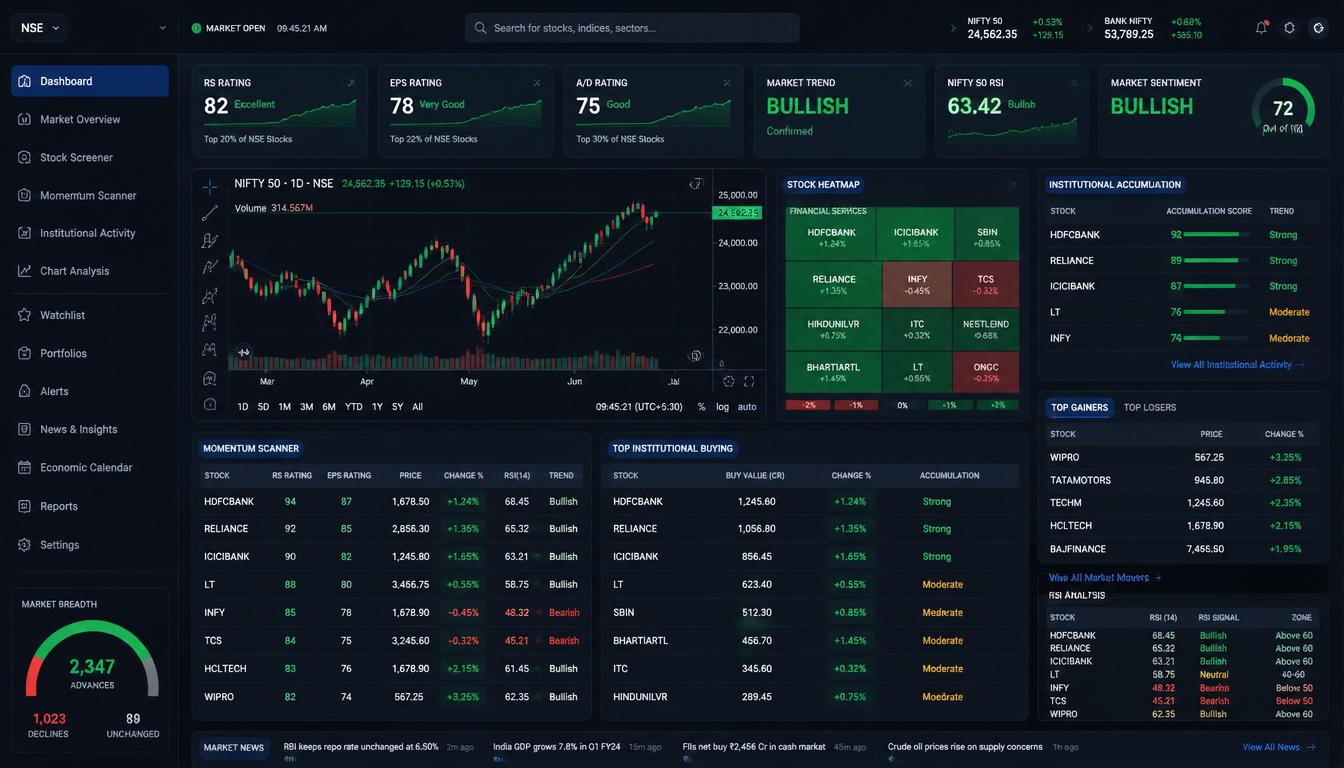
The Techno Funda Stock Screener is an advanced NSE stock screening platform designed for traders and investors who want to combine technical analysis with strong company fundamentals. Instead of relying only on chart patterns or only on financial ratios, this screener helps users identify stocks that show both strong price momentum and improving business performance.
Modern market leaders are often discovered when technical strength and earnings growth start moving together. Stocks showing strong Relative Strength Ratings, improving EPS trends, institutional accumulation and bullish price action frequently outperform weaker stocks during strong market phases. This screener helps traders quickly discover such opportunities using powerful filters built specially for Indian stock market participants.
What is Techno Funda Investing?
Techno funda investing is a hybrid market approach that combines technical indicators with fundamental analysis. Pure technical traders mainly focus on charts, price action, momentum and trend analysis. Long-term investors generally focus on earnings growth, balance sheet quality, business expansion and valuation metrics. The techno funda approach attempts to combine the best aspects of both strategies.
For example, a stock may have excellent earnings growth but weak price momentum because institutions are not actively buying it. Another stock may show strong price momentum temporarily, but weak business fundamentals that cannot sustain long-term growth. By screening stocks using both technical and fundamental parameters together, investors can identify stronger quality setups with a better probability of success.
This strategy has become increasingly popular among swing traders, position traders and growth investors because institutional money flow often enters fundamentally strong companies before major price expansions occur. Traders who monitor earnings growth together with Relative Strength and Accumulation Distribution patterns can often identify market leaders earlier.
Key Metrics Used in Techno Funda Stock Screener
RS Rating
RS Rating or Relative Strength Rating measures how strongly a stock is performing compared to the broader market. Stocks with higher RS Ratings generally outperform weaker stocks during bullish market phases. A high RS Rating often indicates institutional participation, momentum buying and stronger trend continuation probability.
Stocks with RS Ratings above 80 are generally considered strong momentum candidates, while ratings below 40 usually indicate weaker relative performance. Traders often combine RS Rating with trend analysis and volume behaviour to identify leading sectors and strong breakout candidates.
EPS Rating
The EPS Rating measures earnings strength using yearly EPS growth and multi-year EPS CAGR analysis. Companies with strong earnings growth often attract institutional investors because rising profits usually support long-term business expansion and shareholder value creation.
The EPS Rating system used in this screener gives higher scores to companies showing stable and accelerating earnings performance. Companies with weak or declining earnings generally receive lower scores, while turnaround businesses with improving profitability can gradually improve their ratings over time.
A/D Rating
Accumulation Distribution Rating measures institutional buying and selling activity based on price and volume analysis. Stocks showing heavy accumulation often experience stronger bullish trends because large institutions gradually build positions over extended periods.
The A/D Rating ranges from A+ to E. Stocks with A or A+ ratings generally indicate strong institutional buying, while D or E ratings may suggest institutional selling pressure. Traders frequently combine A/D Rating with RS Rating to confirm momentum strength.
RSI Indicator
The Relative Strength Index or RSI is one of the most widely used momentum indicators in technical analysis. RSI helps identify overbought and oversold conditions while also measuring momentum strength.
Generally, an RSI above 70 indicates overbought conditions, while an RSI below 30 suggests oversold conditions. However, during strong bull markets, high-quality momentum stocks can remain overbought for extended periods while continuing to rally further.
Trend Analysis
Trend analysis evaluates the overall market direction of a stock using moving averages and price behaviour. Stocks trading above important moving averages usually indicate stronger bullish momentum, while stocks trading below these levels often show weaker technical structures.
This screener classifies stocks into Bullish, Bearish and Neutral categories so traders can quickly focus on stocks aligned with their preferred trading strategy.
ROE and PE Ratio
ROE or Return on Equity helps investors evaluate how efficiently a company generates profits using shareholder capital. Higher ROE values generally indicate stronger management efficiency and business quality.
The P/E ratio or Price to Earnings Ratio, measures valuation. Growth stocks often trade at higher PE ratios because investors expect future earnings expansion. However, extremely high valuations can sometimes increase risk during market corrections.
How to Use This Stock Screener Effectively
Momentum Stock Screening
Traders looking for momentum opportunities can screen for stocks with an RS Rating above 80, a Bullish trend and an A or B Accumulation Distribution Rating. Such combinations often indicate institutional participation together with strong market momentum.
Adding RSI filters between 50 and 70 can further help identify stocks that are trending strongly without being excessively overbought.


Growth Investing Opportunities
Long-term growth investors can focus on companies with strong EPS Ratings, healthy ROE and improving price momentum. Businesses showing consistent earnings growth, together with improving institutional activity, often become long-term market leaders.
Investors may also combine valuation filters, such as moderate PE ratios, together with improving EPS growth to identify reasonably valued growth opportunities.
Swing Trading Strategies
Swing traders can use this screener to identify short-term breakout candidates showing improving Relative Strength and bullish trend structures. Combining RSI analysis with momentum filters can help identify stocks preparing for fresh directional moves.
Stocks moving from Moderate to Strong institutional activity categories often experience improved liquidity and stronger participation from larger market participants.
Advantages of Using Techno Funda Analysis
Better Stock Selection
Combining technical and fundamental analysis reduces dependency on a single factor. Technical indicators alone can sometimes generate false signals, while purely fundamental investing may ignore market momentum and institutional participation.
Institutional Tracking
The inclusion of A/D Ratings and Relative Strength analysis helps traders monitor institutional activity more effectively. Institutions generally accumulate stronger businesses over extended periods before large price expansions become visible to retail participants.
Faster Market Scanning
Instead of manually checking hundreds of charts and financial statements, traders can use predefined filters to quickly identify high-quality setups. This significantly improves market scanning efficiency and reduces analysis time.
Sector Rotation Analysis
Strong Relative Strength often appears first in leading sectors before broader market participation increases. Traders can use the screener to identify emerging sector leaders early during new market cycles.
Important Risk Management Considerations
No stock screener can guarantee profits or eliminate market risk. Even fundamentally strong companies can experience temporary price corrections during broader market weakness. Traders should always combine screening results with proper position sizing, stop loss management and broader market analysis.
Momentum stocks can sometimes become highly volatile, especially during earnings seasons and major economic events. Investors should avoid chasing extended rallies without evaluating risk-reward conditions carefully.
It is also important to diversify across sectors instead of concentrating only on a small group of momentum stocks. Combining strong stock selection with disciplined risk management generally produces more consistent long-term results.
Why StockManiacs Techno Funda Screener is Different
Unlike basic stock screeners that only focus on valuation ratios or simple technical indicators, the StockManiacs Techno Funda Screener combines multiple professional style market parameters together in one platform. Traders can screen stocks using Relative Strength, EPS Rating, A/D Rating, RSI, trend analysis and profitability metrics simultaneously.
All stock results inside the screener link directly to detailed stock analysis pages containing technical commentary, financial metrics, institutional ratings and price analysis. This creates a much more efficient workflow for both traders and investors.
The screener is specially optimised for Indian stock market participants and continuously updates stock data, technical indicators and ranking systems to help users identify stronger quality NSE stocks.
Final Thoughts
The Techno Funda Stock Screener is designed to help traders and investors discover fundamentally strong stocks with improving technical momentum and institutional participation. By combining Relative Strength analysis, EPS growth, Accumulation Distribution patterns, RSI momentum and profitability metrics together, users can identify stronger quality setups more efficiently.
Whether you are a swing trader searching for momentum breakouts, a growth investor looking for fundamentally strong companies or a positional trader analysing institutional accumulation, this screener can help streamline your stock selection process. Consistent research, disciplined execution and proper risk management remain essential for long-term market success.
Internal Resources
For intraday gap scanners, open-high-low strategies and breakout screening, check our NSE Stock Screener.