S&P 500 Futures are one of the most reliable indicators of overall US market sentiment. Unlike technology-heavy indices, the S&P 500 represents a broad range of sectors, making it a balanced benchmark for understanding the direction of the global equity market. This page provides a comprehensive view of S&P 500 Futures, including live real-time charting, technical indicators, pivot levels, and a structured signal engine to support trading decisions.
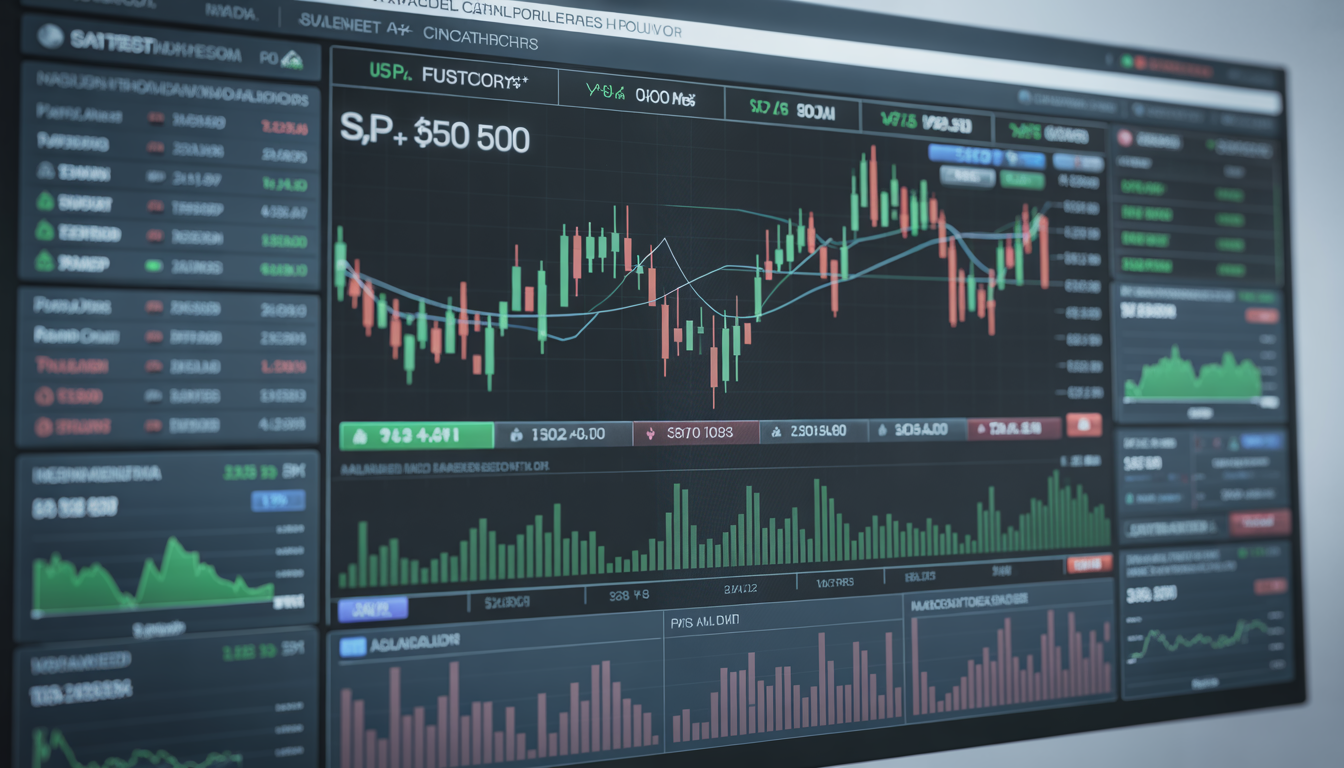
Live S&P 500 Futures Chart
The chart supports multiple timeframes:
- 1 Minute (1M)
- 5 Minute (5M)
- Daily
Short-term traders can focus on 1-minute and 5-minute charts, while the daily timeframe helps identify broader market direction.
Live Data and Signals Dashboard
The dashboard provides:
- Live price tracking
- Trend direction using moving averages
- Momentum readings through RSI
- VWAP positioning
- Trading signals
- Market strength indicators
What Are S&P 500 Futures
S&P 500 Futures are derivative contracts that track the expected future value of the S&P 500 index. They are widely used by institutional and retail traders to hedge risk, speculate on market direction, and analyse macroeconomic sentiment.
Because the S&P 500 includes companies from multiple sectors, its futures provide a diversified view of market conditions.
Why Traders Follow S&P 500 Futures
Broad Market Representation
The S&P 500 covers a wide range of industries, making it a strong indicator of overall economic health.
Pre-Market Insights
Futures trading begins before the stock market opens, giving traders early signals about potential market direction.
Global Influence
Movements in S&P 500 Futures often influence markets worldwide, including Europe and Asia.
Technical Analysis Framework
Moving Averages
EMA20 and EMA50 are used to identify trends. When short-term averages are above long-term averages, the trend is considered bullish.
Relative Strength Index
RSI helps identify momentum and potential reversals. High values indicate strength, while low values suggest weakness.
VWAP Analysis
VWAP acts as a reference level for institutional trading activity and helps determine fair value.
Pivot Levels and Key Zones
<div id="sp500-futures-pivot-widget"></div>
Pivot levels are calculated from the previous day’s price action and act as important support and resistance zones.
These levels help traders:
- Identify breakout opportunities
- Set stop-loss levels
- Define target areas
Signal Engine Methodology
The signal engine combines multiple layers of analysis:
- Daily timeframe defines market bias
- 5-minute timeframe confirms trend
- 1-minute timeframe identifies the entry
Signals generated include:
- Strong Buy
- Buy
- Sell
- Strong Sell
- Hold
This structured approach improves consistency and reduces noise.
Trading Hours and Market Access
S&P 500 Futures trade nearly 24 hours a day, allowing traders to respond to global events in real time. This continuous trading environment makes it possible to monitor sentiment across different regions.
Understanding Market Bias
Market bias is determined by analysing trend direction and price positioning relative to key levels.
- Bullish bias indicates upward momentum
- Bearish bias indicates downward pressure
Aligning trades with the prevailing bias improves probability.
Multi-Timeframe Analysis
Successful traders use multiple timeframes to confirm signals.
Daily Chart
Provides long-term trend direction
5-Minute Chart
Confirms short-term trend
1-Minute Chart
Used for precise execution
Combining these timeframes helps reduce false signals.
Risk Management Principles
Effective risk management is essential when trading S&P 500 Futures.
Key principles include:
- Using stop-loss orders
- Managing position size
- Avoiding excessive leverage
- Following a disciplined plan
Protecting capital should always be the primary goal.
Volume and Market Participation
Volume confirms the strength of price movements. High volume indicates strong participation, while low volume suggests weak conviction.
VWAP combined with volume provides insight into institutional positioning.


Global Factors Affecting S&P 500 Futures
S&P 500 Futures are influenced by several factors:
- Economic data releases
- Central bank policies
- Corporate earnings
- Geopolitical developments
Understanding these drivers helps traders anticipate market behaviour.
Trading Strategies
Breakout Trading
Entering trades when the price moves beyond key levels
Pullback Trading
Entering during retracements within a trend
Trend Following
Trading in the direction of the dominant trend
Each strategy requires discipline and proper execution.
Importance of Consistency in Trading
Consistency is one of the most important factors in trading success. Rather than focusing on individual trades, traders should aim to follow a repeatable process.
This includes:
- Defining clear entry and exit rules
- Maintaining discipline
- Avoiding emotional decisions
- Tracking performance
Over time, consistency leads to improved results.
Intraday Trading Considerations
Intraday trading requires fast decision-making and strong discipline. Traders must be aware of market conditions, volatility, and liquidity.
Key considerations:
- Trade during high-volume sessions
- Avoid low-liquidity periods
- Monitor news events
- Use tight risk controls
Identifying High-Probability Trades
High-probability trades occur when multiple factors align:
- Trend alignment across timeframes
- Strong momentum
- Price near key levels
Combining these factors increases the likelihood of success.
Role of Economic Events
Economic data releases can significantly impact S&P 500 Futures. Events such as inflation reports, employment data, and central bank announcements often lead to sharp price movements.
Traders should:
- Be aware of event schedules
- Avoid entering trades before announcements
- Adjust strategies based on volatility
Using S&P 500 Futures for Market Forecasting
S&P 500 Futures are often used as a leading indicator for the overall stock market. Traders analyse futures movements to anticipate how the market may open and behave during the day.
Rising futures typically indicate positive sentiment, while falling futures suggest caution.
Importance of Key Price Levels
Monitoring key price levels is essential for effective trading.
Important levels include:
- Previous day high and low
- Pivot points
- VWAP levels
- Moving averages
These levels act as decision zones where price reactions are likely.
Combining Indicators for Better Results
Using multiple indicators on S&P 500 Futures live data together improves accuracy:
- Moving averages for trend
- RSI for momentum
- VWAP for value
When indicators align, signals become more reliable.
Developing a Daily Trading Routine
A structured routine helps traders stay focused and consistent.
Daily routine may include:
- Reviewing market bias
- Identifying key levels
- Monitoring signals
- Executing trades with discipline
Final Thoughts
S&P 500 Futures provide a comprehensive view of market sentiment and are widely used by traders worldwide. By combining technical analysis, structured signals, and disciplined risk management, traders can improve decision-making and performance.
This page offers a complete framework for analysing S&P 500 Futures, helping you stay informed and trade with confidence.
Final Advice
Successful trading requires patience, discipline, and continuous learning. Use data-driven insights, follow your strategy, and always prioritise risk management.
With the right approach, S&P 500 Futures can be a powerful tool for understanding and trading global markets.