Track real-time technical analysis of the Indian stock market index technicals, including Nifty 50 and Bank Nifty. This section provides simplified insights using price trends, indicators, and key market levels to help traders make better decisions.
Whether you trade intraday or follow positional strategies, understanding this analysis is essential for identifying trend direction, momentum, and potential reversals.
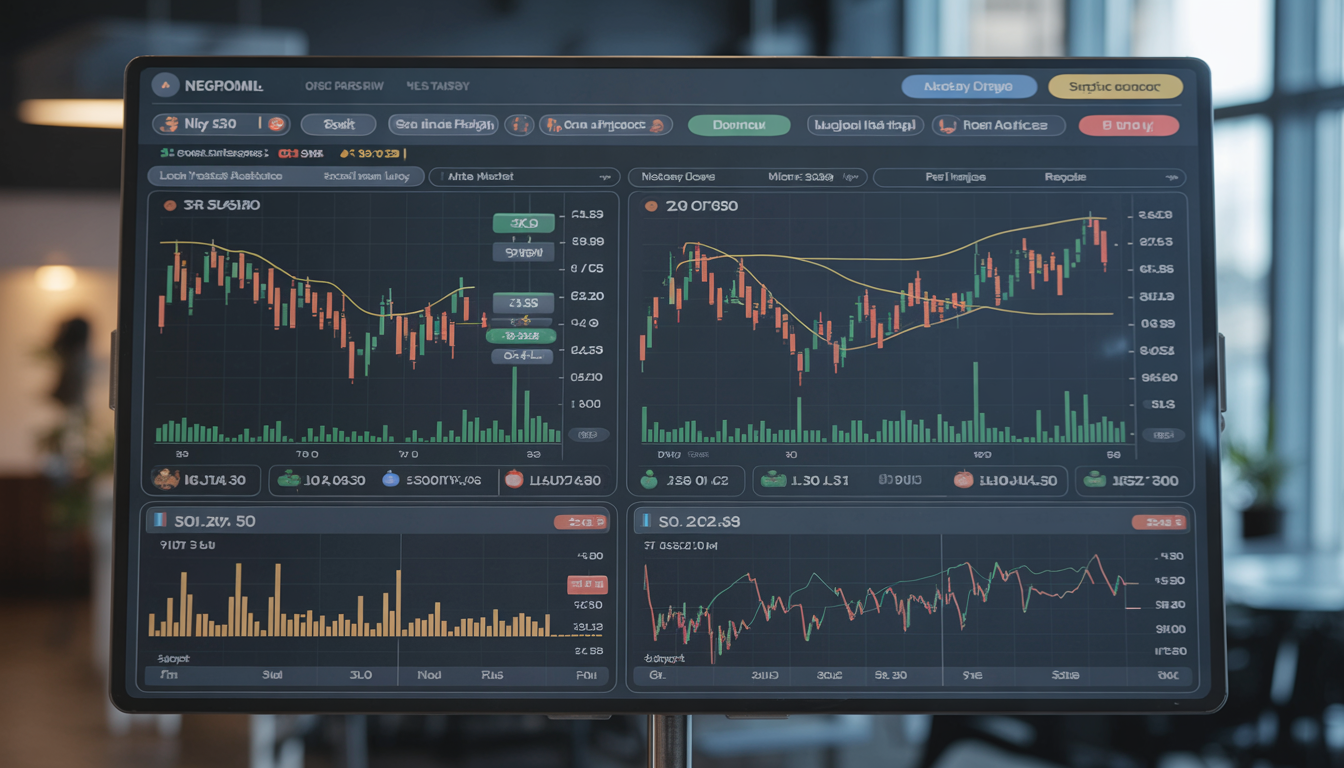
Index Technicals and Analysis Tools
- Nifty 50 Technical Analysis Dashboard – Track Nifty trend, support-resistance levels, and key indicators.
- Bank Nifty Technical Analysis Dashboard – Analyse Bank Nifty price action and volatility with technical signals.
What You Get
- ✔ Real-time index trend direction
- ✔ Key support and resistance levels
- ✔ Technical indicators simplified
- ✔ Actionable insights for traders
⚡ Why Index Technicals Matter
Nifty and Bank Nifty drive the overall sentiment of the Indian stock market. By analysing the indices’ technical analysis, traders can align their positions with market direction, avoid false signals, and improve timing for entry and exit.
Start Your Analysis
Select any dashboard above to explore live index data, technical indicators, and trend signals for smarter trading decisions.