Volatility is a measure of the variation of the price of a financial instrument over time. Historic volatility is derived from a time series of past market prices. Volatility is normally expressed in annualised terms, and it may either be an absolute number (Rs. 5) or a fraction of the mean (5%). This Volatility Calculator uses volatility to create an intraday trading system and generate buy-sell levels. Mobile users may need to scroll horizontally to see the full Volatility Calculator below.
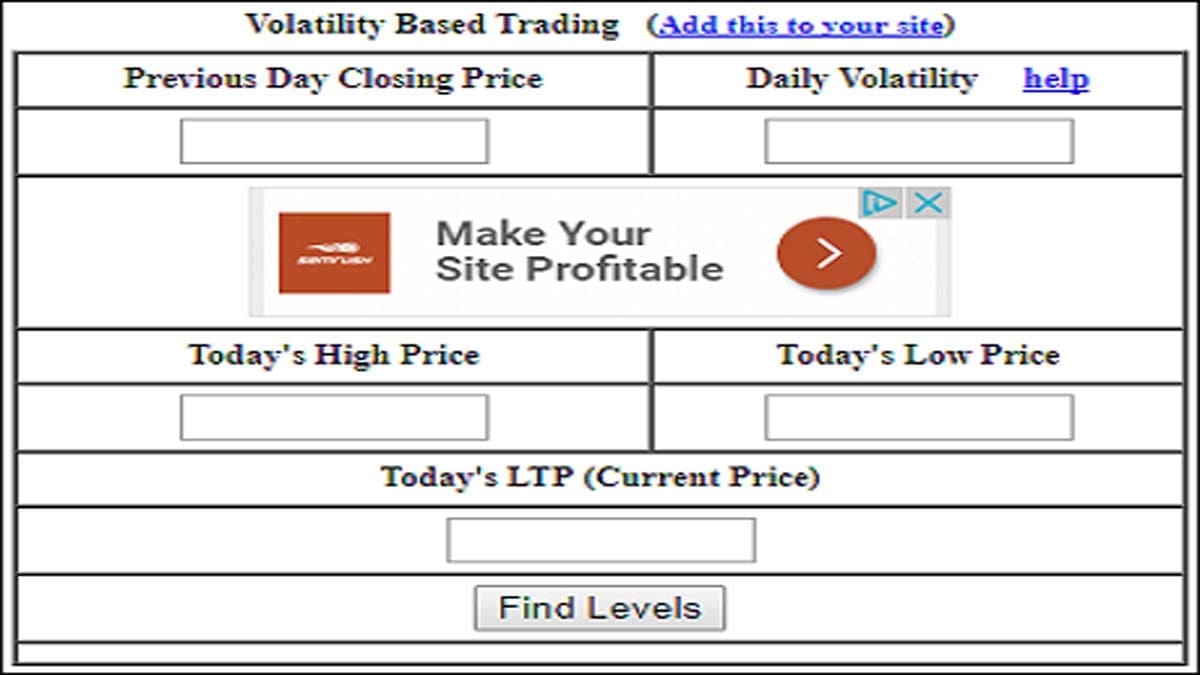
Volatility Calculator for Intraday Trading
How to use this volatility calculator?
- To use this calculator, you need the previous day’s closing price and the current day’s prices.
- Apart from this, you also need the volatility value for any stock. You get this value from the NSE India on that stock’s or future’s page. Use this pictorial guide provided here.
This calculator can be used at any time after one hour, ie,10:00 AM during the day. Ideal time is 10:00 – 11:30 AM.
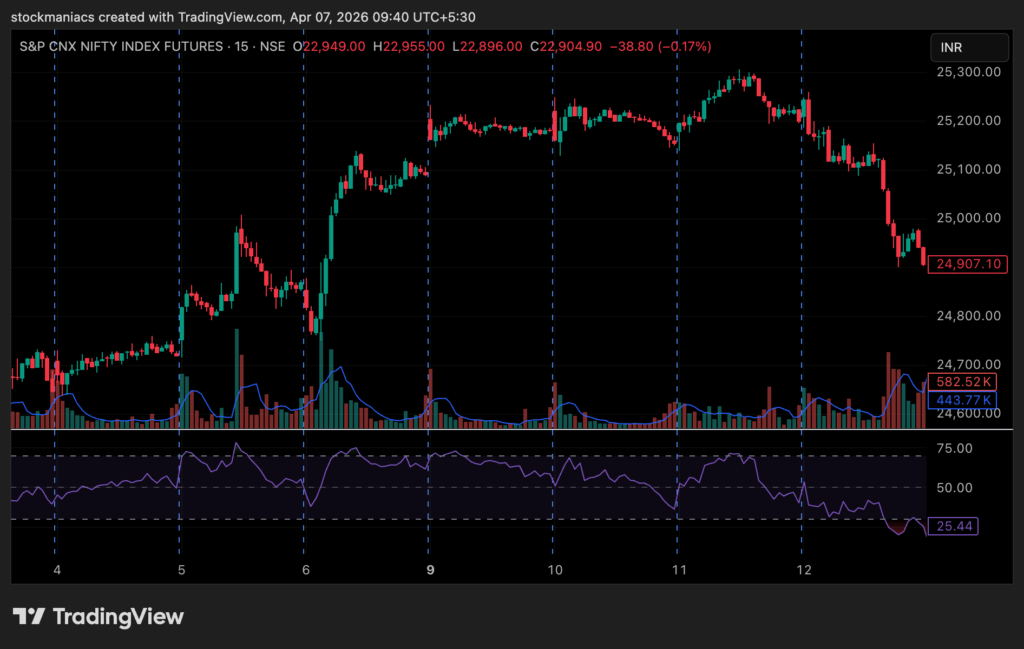
- Now, let us see how to use this calculator. Let’s say we want to find the values for Nifty Futures on the 12th of June 2025 at 10.00 am.
- I will first see the closing price of Nifty Futures for the previous day. (Close price is 25211.70)
- To find the volatility, I open the Get Quote for Nifty Future on www.nseindia.com. On the page, I see the volatility at 0.86
- After entering the Closing Price, volatility as seen on the NSE website, I will enter the current day’s high (25260), low (25141) and last traded price (25168).
- I calculate the levels using the button.
- I get the message as:
Sell at/below 25200.5 for the following Target and Stoploss
Target 1: 25092.09, Target 2: 25037.88, Target 3: 24983.68, Target 4: 24875.27, Target 5: 24821.06
Stoploss : 25260 - The Nifty Futures closed at 24907.10. Target 1, Target 2, Target 3 and almost Target 4 were achieved.
Note: The above calculations are just an indication/suggestion based on volatility. You may include other indicators as well to confirm the prices.
How Does this Volatility Calculator Work?
We have seen that many traders never achieve success in intraday trading. Learning a few simple techniques can make someone a winner in intraday trading. Here is one such simple technique to use for intraday trading.
Interpret the daily volatility. It is the parameter which will give you the most likely move the scrip can swing in a day. In this case, the term “swing” means the high and low difference in a day.
Then the next question is how to find the volatility. You need to refer to the daily volatility column given on the NSE site against your scrip, or you may check for the pictorial guide provided above. I have taken the same approach to explain this concept to you.
Suppose I got a figure of 0.86 for the 8th April 2010 for Nifty futures. In other words, it says the Nifty future has the potential to generate 0.86% returns today either in the buy side or in the sell side. For example, if the midpoint between that day’s high (5370) and low (5348) in Nifty future is 5350, it may generate 5350 X 0.86% = 46 points return on either side. This small amount of arithmetic information is sufficient for us to make a wise trade decision.
This same trick can be applied to all the stocks just by referring its daily volatility and applying the mid-point concept on it. Try to use the above-discussed technique in Nifty Future or on any liquid stocks or futures and experience the success.
Frequently Asked Questions
Volatility measures how much a stock price moves within a given period. Higher volatility means larger price swings.


Daily volatility values are available on the NSE India quote page for stocks and futures.
Yes, but it works best for liquid stocks, index futures, and instruments with high trading volume.
The ideal time is between 10:00 AM and 11:30 AM, after the market establishes a range.
Conclusion
Volatility is one of the most powerful yet simple concepts used in intraday trading. By understanding how much a stock or index is likely to move during the day, traders can estimate realistic price targets and plan trades more effectively. The Volatility Calculator presented above converts this concept into a practical trading tool by combining the previous day’s close, current day’s high–low range, and the volatility percentage from NSE to generate potential buy or sell levels along with targets and stop-loss.
While this method provides a logical framework for identifying intraday opportunities, it should not be used in isolation. Smart traders always confirm signals using additional indicators such as trend direction, support and resistance levels, volume behaviour, or price action. Risk management is equally important, and traders should always respect stop-loss levels to protect their capital.
Used properly, volatility-based trading can help traders develop discipline and structured decision-making in intraday markets. Practice this method on liquid stocks or index futures, observe how the price reacts around the calculated levels, and gradually refine your strategy for consistent results.
Check Our Other Trading & Investment Tools
- Gann Square of 9 Calculator – Forecast support, resistance, and price targets using the famous Gann methodology.
- Nifty Trend Finder Calculator – Identify the current Nifty market trend using technical indicators and price action.
- Pivot Point Calculator – Calculate pivot levels, support, and resistance for intraday trading.
- Camarilla Calculator – Generate precise intraday support and resistance levels using Camarilla formulas.
- Elliott Wave Calculator – Analyse wave structures and potential market movement patterns.
- Fibonacci Calculator – Find Fibonacci retracement and extension levels for technical analysis.
- Mutual Fund Return Calculator – Estimate SIP and lump sum mutual fund investment returns easily.
- LIC Maturity Calculator – Calculate the estimated maturity value for LIC insurance policies.
- LIC Surrender Value Calculator – Estimate the surrender value of your LIC policy quickly.