Looking for powerful stock market screeners and charting tools to improve your edge? At StockManiacs, we go beyond generic solutions. Our members get access to high-performance trading dashboards and exclusive screeners. We also provide fully configured chart setups that simplify stock picking and amplify your trading precision.
Whether you’re an intraday trader seeking breakout entries, a swing trader tracking chart patterns, or a long-term investor spotting high-conviction opportunities — our tools are made for real-world use. You don’t need to be a tech expert. We’ve designed everything to be plug-and-play, saving you hours of setup and confusion.
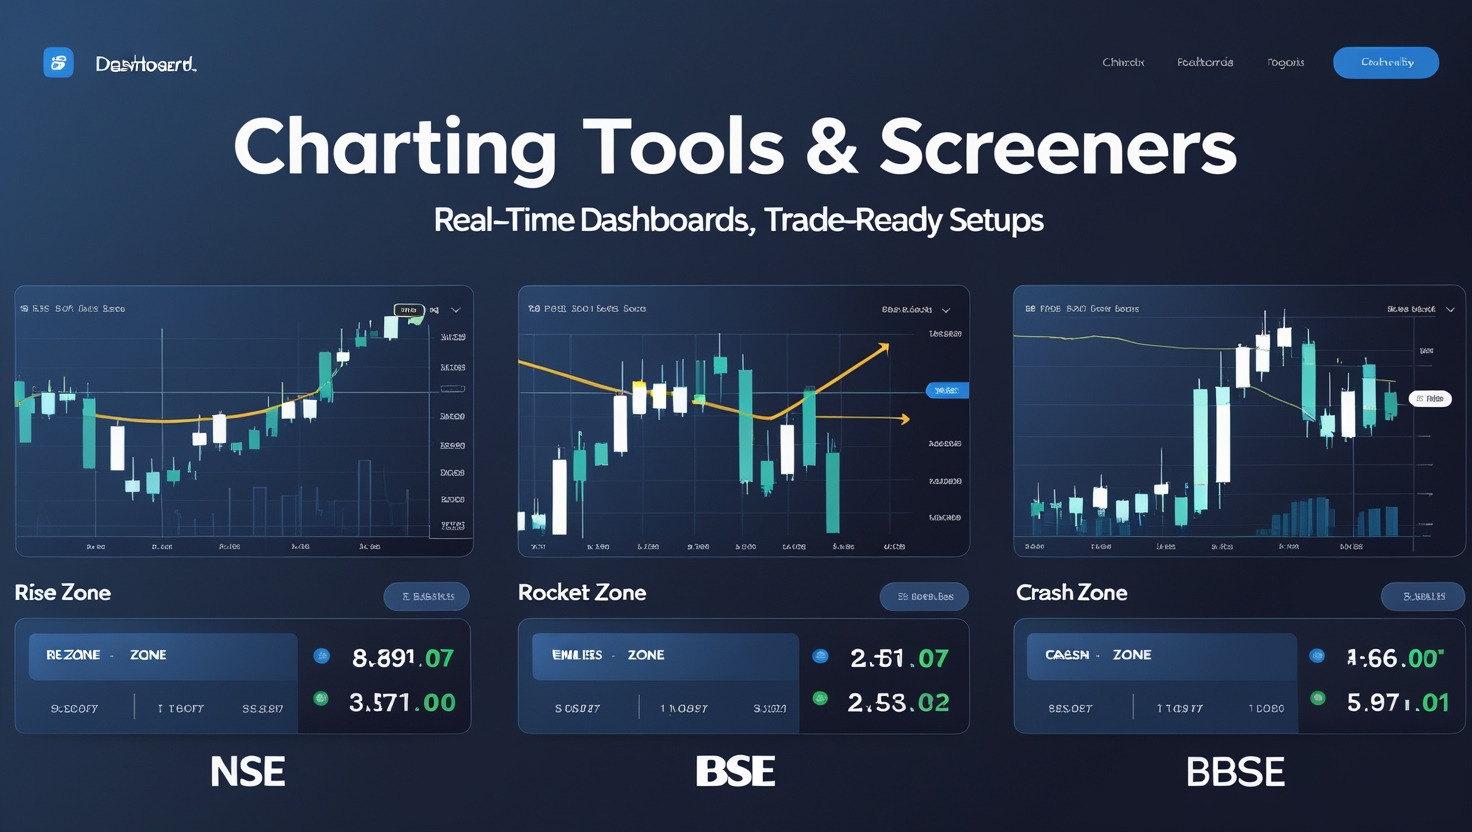
📊 Proprietary Trading Dashboard & Screener
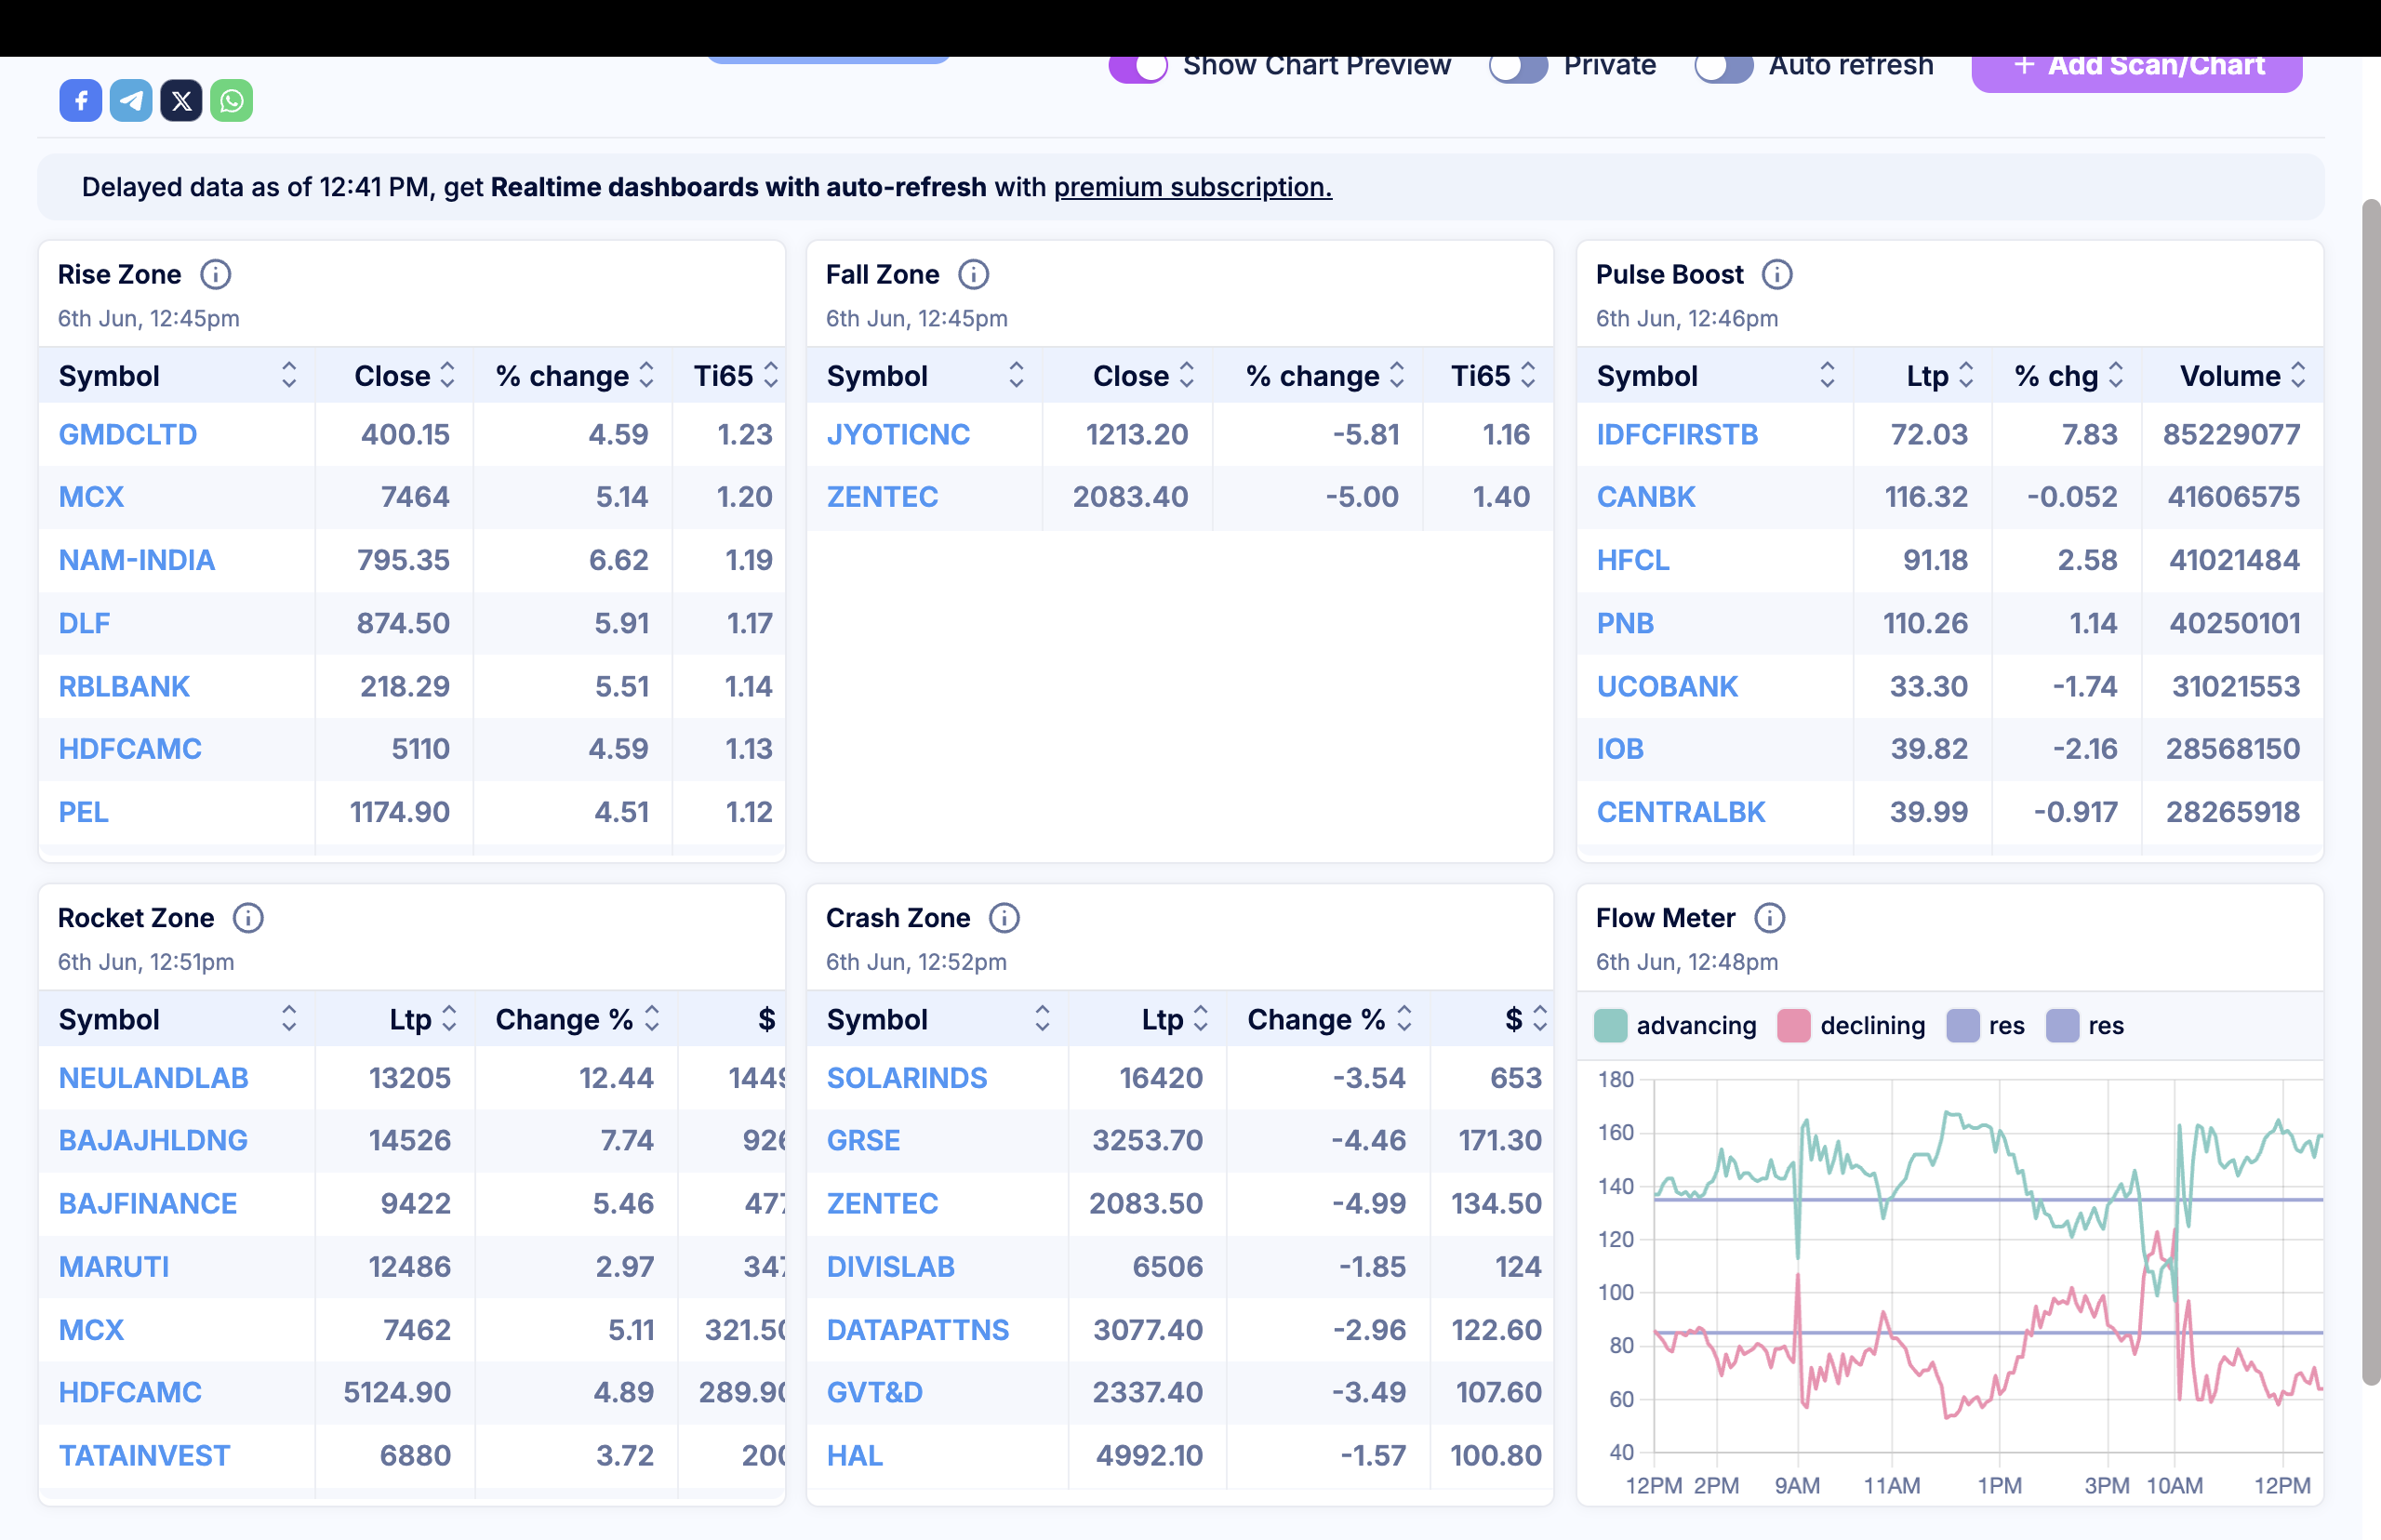
Our proprietary Trading Dashboard displays real-time stock movement across multiple zones — like Rise Zone, Fall Zone, Rocket Zone, and Crash Zone — using powerful algorithms. You get instant visual clarity on what’s trending up, what’s crashing, and where the momentum is shifting. It also includes:
- ✅ Volume surge detectors (Pulse Boost)
- ✅ Flow Meter with live advancing vs. declining stocks
- ✅ Breakout & reversal zone insights
- ✅ 100% mobile & browser compatible
📈 Members-Only Charting Setup
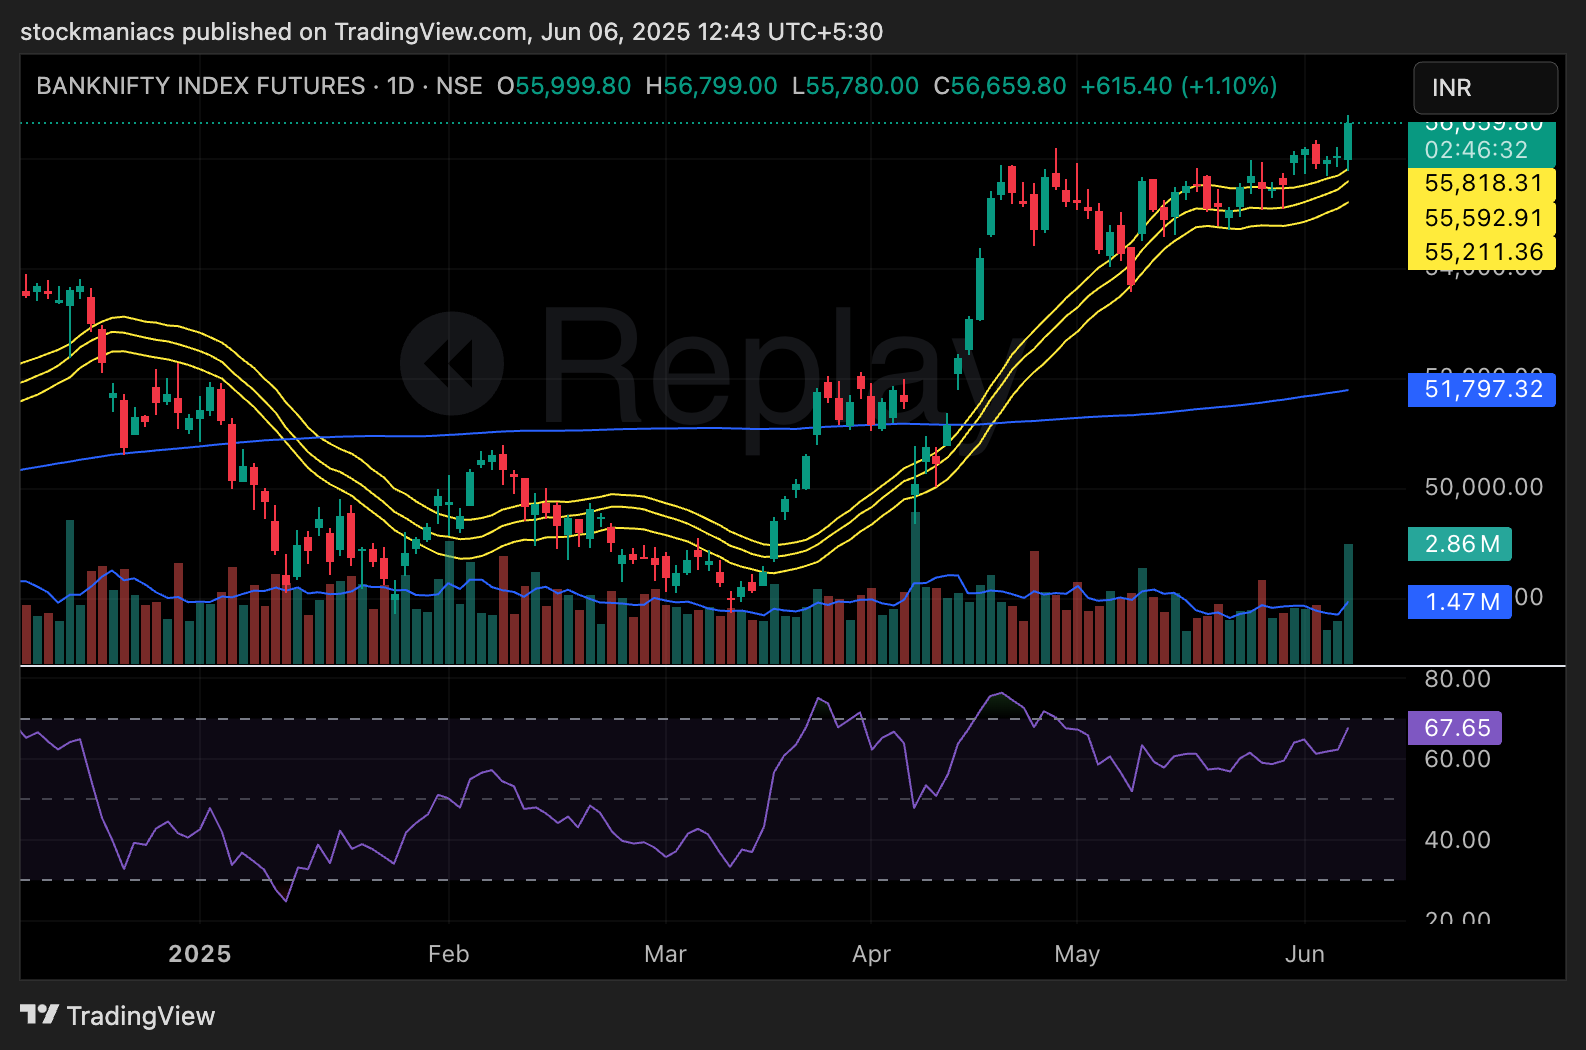
We have designed TradingView-powered chart layout for both beginners and experienced traders. It features a clean layout with stacked EMAs, VWAP, volume overlays, and RSI — enabling clear, structured decision-making. With this setup, you’ll be able to:
- ✔️ Spot trend continuations and reversals with confidence
- ✔️ Align price and momentum using RSI & volume confirmation
- ✔️ Visualize clean support/resistance and confluences
- ✔️ Improve your entry/exit accuracy drastically
All tools and setups are exclusively offered to our clients who open a Demat account with us. Start by opening your account below and then reach out for activation: